
|
The St. Joe Company (Joe): 5 Forces Analysis [Jan-2025 Mis à jour] |
Entièrement Modifiable: Adapté À Vos Besoins Dans Excel Ou Sheets
Conception Professionnelle: Modèles Fiables Et Conformes Aux Normes Du Secteur
Pré-Construits Pour Une Utilisation Rapide Et Efficace
Compatible MAC/PC, entièrement débloqué
Aucune Expertise N'Est Requise; Facile À Suivre
The St. Joe Company (JOE) Bundle
Plongez dans le paysage stratégique de St. Joe Company (Joe), où le développement immobilier de la Floride répond à une analyse compétitive dans le cadre des puissants forces de Michael Porter. Dans cette exploration, nous démêlerons comment un 160 000 acres Le portefeuille de terres, le positionnement stratégique et la dynamique de marché unique façonnent l'environnement concurrentiel de l'entreprise, révélant les forces complexes qui stimulent le succès dans le monde complexe du développement immobilier et de la gestion des terres.
The St. Joe Company (Joe) - Porter's Five Forces: Bargaining Power des fournisseurs
Fournisseurs limités sur le marché du développement immobilier en Floride
En 2024, St. Joe Company possède environ 172 000 acres de terrain dans le nord-ouest de la Floride, représentant un avantage important sur le marché dans les négociations des fournisseurs.
| Catégorie de propriété foncière | Acres | Pourcentage de terres totales |
|---|---|---|
| Terre de développement | 75,000 | 43.6% |
| Conservation / Terre préservée | 52,000 | 30.2% |
| Utilisation indéterminée Terre | 45,000 | 26.2% |
Intégration verticale dans la gestion des terres
Le rapport financier de St. Joe 2023 indique 412,7 millions de dollars de revenus immobiliers, démontrant de solides capacités d'intégration verticale.
- La propriété directe des terres réduit la dépendance externe
- L'infrastructure de développement interne minimise les risques de la chaîne d'approvisionnement
- Les actifs fonciers propriétaires fournissent un effet de levier de négociation stratégique
Coûts de commutation des fournisseurs
| Catégorie des fournisseurs | Coût de commutation estimé | Niveau de complexité |
|---|---|---|
| Matériaux de construction | Faible (5 000 $ - 25 000 $) | Faible |
| Matériel lourd | Moyen (50 000 $ - 150 000 $) | Moyen |
| Services d'ingénierie spécialisés | High (250 000 $ - 750 000 $) | Haut |
Coût moyen du matériau de construction par acre: 17 500 $, indiquant les frais de transition des fournisseurs relativement gérables.
The St. Joe Company (Joe) - Porter's Five Forces: Bargaining Power of Clients
Composition de la clientèle
En 2024, les segments de clients de la St. Joe Company comprennent:
- Immobilier résidentiel: 42% des revenus totaux
- Développement commercial: 33% des revenus totaux
- Secteur de l'hôtellerie: 25% des revenus totaux
Analyse des prix du marché
| Type de propriété | Fourchette de prix moyenne | Segment de marché |
|---|---|---|
| Terrains résidentiels | $250,000 - $750,000 | Panhandle de Floride haut de gamme |
| Terre commerciale | $500,000 - $2,500,000 | Développement côtier |
| Propriétés de l'hospitalité | $3,000,000 - $15,000,000 | Développement du complexe / hôtelier |
Options des clients et concurrence du marché
Florida Panhandle Real Estate Market Concurrentiel Paysage:
- Total des développeurs concurrents dans la région: 17
- Part de marché St. Joe Company: 22,5%
- Options alternatives de développement des terres: 5-7 concurrents majeurs
Potentiel de personnalisation
Offres de personnalisation:
- Variations de taille de tracé terrestre: 1-50 acres
- Plans de développement flexibles: 3-5 options de configuration
- Adaptations de zonage personnalisées: Disponible dans 78% du portefeuille
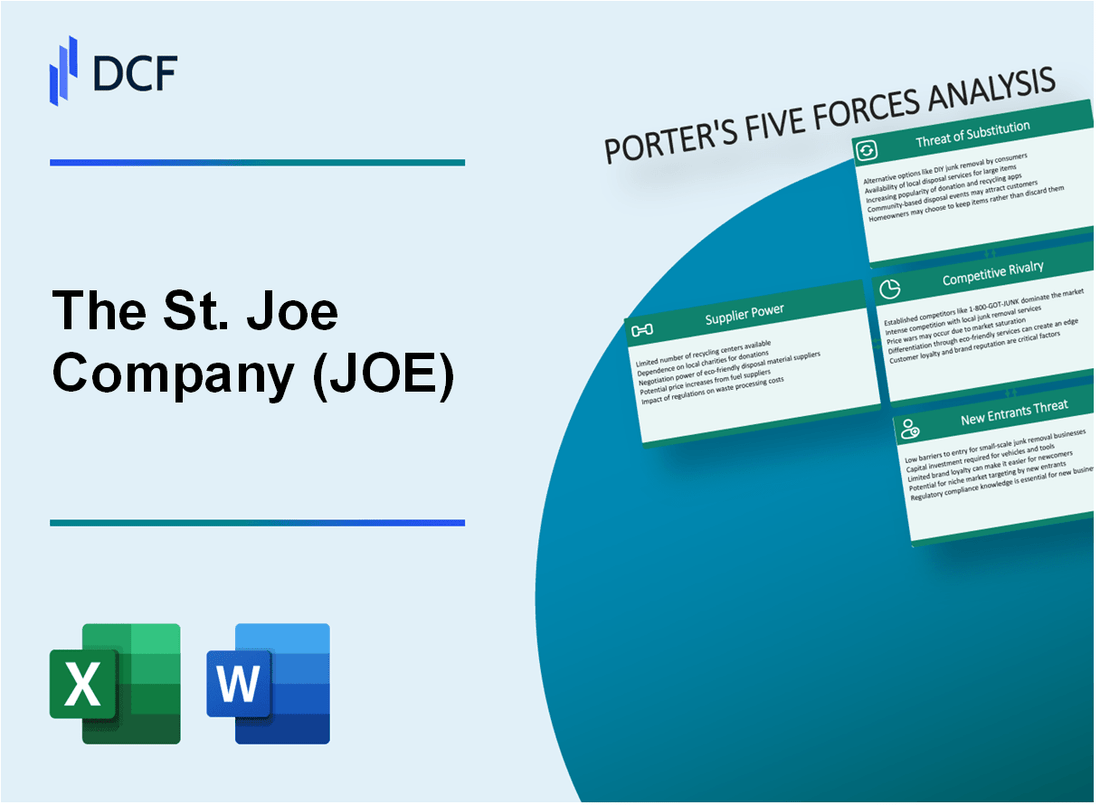
The St. Joe Company (Joe) - Five Forces de Porter: Rivalité compétitive
Paysage compétitif Overview
Depuis 2024, St. Joe Company fait face à une concurrence modérée sur le marché du développement immobilier de Florida Panhandle. Le positionnement concurrentiel de l'entreprise se caractérise par plusieurs facteurs clés:
| Métrique | Valeur de l'entreprise St. Joe |
|---|---|
| Total foncier | 167 000 acres dans le nord-ouest de la Floride |
| Part de marché dans Panhandle | Environ 38% du développement des terres à grande échelle |
| Nombre de projets de développement actifs | 12 communautés planifiées par la maîtrise |
Dynamique compétitive
Le paysage concurrentiel révèle un nombre limité de sociétés de développement foncier à grande échelle dans la région:
- Les principaux concurrents régionaux comprennent le groupe Emerald Coast Realty
- Partenaires de développement de la côte du Golfe
- Investisseurs terrestres du nord-ouest de la Floride
Avantages compétitifs
La position concurrentielle de la St. Joe Company est renforcée par:
| Type d'avantage | Caractéristique spécifique |
|---|---|
| Propriété terrestre | 167 000 acres stratégiquement situés |
| Capacité de développement | 12 Communautés planifiées de maîtrise active |
| Ressources financières | 644,7 millions de dollars d'actifs totaux (2023 Q4) |
Stratégie de différenciation du marché
Approche de développement unique:
- Concentrez-vous sur les communautés planifiées de haute qualité
- Modèle de développement à usage mixte intégré
- Accent mis sur les infrastructures durables
Métriques d'intensité compétitive
| Indicateur compétitif | Mesures |
|---|---|
| Nombre de concurrents régionaux | 5-7 joueurs importants |
| Ratio de concentration du marché | Environ 65% contrôlés par les 3 meilleurs développeurs |
| Investissement annuel sur le développement des terres | 87,3 millions de dollars (St. Joe Company 2023) |
The St. Joe Company (Joe) - Five Forces de Porter: menace de substituts
Marchés immobiliers alternatifs en Floride et au sud-est des États-Unis
Alternatives du marché immobilier de la Floride à partir de 2024:
| Marché | Prix moyen des maisons | Taux de croissance annuel |
|---|---|---|
| Orlando | $407,000 | 3.7% |
| Tampa | $392,000 | 4.2% |
| Jacksonville | $318,000 | 2.9% |
| Miami | $498,000 | 5.1% |
Vacances concurrentes et destinations résidentielles
Destinations de vacances concurrentes dans le sud-est des États-Unis:
- Myrtle Beach, Caroline du Sud: 7,3 millions de visiteurs annuels
- Hilton Head Island, Caroline du Sud: 2,5 millions de visiteurs annuels
- Savannah, Géorgie: 14,5 millions de visiteurs annuels
- Gulf Shores, Alabama: 6,8 millions de visiteurs annuels
Dépendance de l'emplacement géographique du travail à distance
Statistiques de travail à distance ayant un impact sur le marché immobilier:
| Catégorie | Pourcentage |
|---|---|
| Travailleurs entièrement éloignés aux États-Unis | 27.5% |
| Travailleurs hybrides aux États-Unis | 32.6% |
| Les travailleurs préférant les options à distance | 58.3% |
Options d'investissement alternatives dans les secteurs de l'immobilier et du développement
Alternatives d'investissement immobilier:
- Trusts de placement immobilier (FPI): 1,2 billion de dollars de capitalisation boursière totale
- Plateformes de financement participatif: 3,8 milliards de dollars de volume d'investissement annuel
- Fonds immobiliers commerciaux: 289 milliards de dollars d'actifs sous gestion
- Fonds de développement résidentiel: 126 milliards de dollars d'investissements totaux
The St. Joe Company (Joe) - Five Forces de Porter: Menace de nouveaux entrants
Exigences de capital initial élevées pour le développement des terres
St. Joe Company possède 175 000 acres de terres en Floride, d'une valeur d'environ 1,2 milliard de dollars en 2023. Les coûts d'acquisition et de développement des terres dans la région varient de 50 000 $ à 250 000 $ par acre en fonction de l'emplacement et de l'utilisation potentielle.
| Catégorie des besoins en capital | Plage de coûts estimés |
|---|---|
| Acquisition de terres | 50 000 $ - 250 000 $ par acre |
| Développement des infrastructures | 5 millions de dollars - 25 millions de dollars par projet |
| Conformité réglementaire | 500 000 $ - 2 millions de dollars par projet |
Des obstacles réglementaires importants sur le marché immobilier de la Floride
La Floride impose des exigences réglementaires strictes pour le développement des terres, notamment:
- Évaluations d'impact environnemental
- Règlement sur la protection des zones humides
- Permis de construction côtière
- Conformité du zonage local
Portfolio de marque et de terrains établis de St. Joe's
Le portefeuille de terrains de St. Joe Company comprend des emplacements stratégiques avec une valeur marchande estimée de 1,2 milliard de dollars. La société fonctionne depuis 1938, avec un avantage concurrentiel important dans le développement immobilier du nord-ouest de la Floride.
| Métrique du portefeuille de terres | Valeur 2023 |
|---|---|
| Superficie totale | 175 000 acres |
| Valeur marchande | 1,2 milliard de dollars |
| Années de fonctionnement | 85 ans |
Zonage complexe et réglementation environnementale
Les réglementations environnementales de la Floride créent des obstacles substantiels pour les nouveaux entrants du marché, avec:
- Études d'impact environnemental obligatoires coûtant 250 000 $ - 1 million de dollars
- Protection des zones humides nécessitant des permis spécialisés
- Restrictions de construction côtière
The St. Joe Company (JOE) - Porter's Five Forces: Competitive rivalry
You're looking at The St. Joe Company's competitive landscape in late 2025, and honestly, the rivalry is intense across the board. JOE competes directly with national homebuilders like D.R. Horton and Lennar in the Florida market, which means they are constantly battling for market share in residential development.
This rivalry is high across all three of The St. Joe Company's core segments: residential, commercial, and hospitality. Even with strong top-line performance, the pressure from established and emerging players in Northwest Florida is constant. The company's Q3 2025 revenue of \$161.1 million shows strong growth, but that growth is being fought for in a competitive arena.
Still, The St. Joe Company holds a significant competitive advantage from its massive, entitled 171,000 acres concentrated in the region. This land bank is the foundation that allows them to control the pace and quality of development, something smaller competitors simply cannot replicate.
Here's a quick look at the segment performance that illustrates where this rivalry is playing out:
| Segment | Q3 2025 Revenue | Year-over-Year Growth |
| Total Consolidated Revenue | \$161.1 million | Up 63% |
| Hospitality Revenue | \$60.6 million | Up 9% |
| Total Real Estate Revenue | \$83.8 million | Up 199% |
| Leasing Revenue | \$16.7 million | Up 7% |
The residential segment, in particular, shows the direct impact of builder competition and demand dynamics. The St. Joe Company sold homesites and townhomes into this competitive environment during the third quarter of 2025:
- Residential real estate revenue reached \$36.8 million, up 94% year-over-year.
- The company sold 189 homesites in Q3 2025, up from 179 in Q3 2024.
- The average homesite base price increased to \$150,000 from \$86,000 in the prior year period.
- Gross margin on these sales improved to 53% from 39% year-over-year.
The ability to command a \$150,000 average base price, even against national players, suggests The St. Joe Company is successfully differentiating its product, likely due to the quality of its entitled land and community planning. Finance: draft a sensitivity analysis on the impact of a 10% drop in average homesite price on Q4 2025 projected margins by next Tuesday.
The St. Joe Company (JOE) - Porter's Five Forces: Threat of substitutes
You're analyzing the competitive landscape for The St. Joe Company, and the threat of substitutes is a real factor you need to model. When a customer can easily switch to an alternative product or service that meets the same need, it puts a ceiling on your pricing power and growth potential. For The St. Joe Company, these substitutes span residential, commercial leasing, and hospitality.
For residential buyers, the most direct substitute is the existing resale housing stock across Florida. You should note that the inventory of existing resale homes in Florida saw a 32% inventory rise by August 2025. This increased supply of alternatives directly competes with new home and homesite sales from The St. Joe Company's communities like Latitude Margaritaville Watersound.
The affordability gap in Florida is significant, pushing potential single-family buyers toward rental options, which act as a substitute for outright purchase. Here's a quick look at the cost differential as of mid-2025 in the broader Florida market, which influences where buyers and renters choose to allocate capital:
| Substitute Category | Metric | Value |
|---|---|---|
| Single-Family Purchase | Median Home Price (Mid-2025) | $415,000 |
| Multi-Family Purchase | Median Condo/Townhouse Price (Mid-2025) | $310,000 |
| Rental Apartment (1-BR Avg) | Average Monthly Rent (2025) | $1,500 to $1,700 |
This cost pressure definitely pushes demand toward renting. For instance, an estimated 904,635 renter households in Florida were cost burdened in 2025, paying more than 40% of their income toward rent, showing the high demand for rental substitutes even at elevated prices.
In the commercial segment, tenants considering The St. Joe Company's leasable space-which totaled approximately 1,177,000 square feet leased at 95% occupancy as of June 30, 2025-can look at properties offered by other regional developers in Northwest Florida. Competitors offer alternatives in office parks, town centers, and industrial complexes like VentureCrossings® Enterprise Centre. The St. Joe Company has a massive entitlement base of over 22 million square feet of commercial space planned by 2064, but regional developers are constantly bringing competing supply online.
For The St. Joe Company's hospitality offerings, which generated a record quarterly revenue of $68.8 million in Q2 2025 and $60.6 million in Q3 2025, the threat comes from vacation rentals and destinations outside of Northwest Florida. Visitors can opt for alternative lodging or entirely different travel experiences. The company's growth is tied to regional visitation, but non-Florida destinations compete for that same discretionary travel spending. The Watersound Club membership, which stood at 3,551 members as of June 30, 2025, also competes with other high-end club and resort memberships across the Southeast.
The St. Joe Company's ability to command premium pricing on its homesites, which saw an average sales price jump of 74% to $150,000 in Q3 2025, is partly dependent on the perceived lack of viable, high-quality substitutes in its specific geographic niche. Still, you have to watch that 32% inventory rise in the broader state market.
The St. Joe Company (JOE) - Porter's Five Forces: Threat of new entrants
You're looking at The St. Joe Company's competitive moat, and the threat of new entrants in their Northwest Florida development space is definitely low. Honestly, it comes down to sheer, unreplicable scale and the regulatory framework they helped shape.
The St. Joe Company's unique scale of land ownership and long-term entitlements creates a massive hurdle. New entrants would need to secure a comparable land bank, which is simply not available in the prime areas of Bay and Walton counties. The company holds about 171,000 acres across Northwest Florida.
Consider the capital required just to match the existing pipeline. The St. Joe Company's residential homesite pipeline stood at over 24,000 homesites in various stages as of June 30, 2025. Acquiring and entitling that volume of land today would require capital expenditures far exceeding what most regional players can muster. For context, The St. Joe Company funded $69.2 million in capital expenditures just for the first half of 2025.
Here's a quick look at the scale you'd be competing against:
| Metric | Value (as of late 2025) | Context |
| Total Land Holdings (NW Florida) | 171,000 acres | Total land bank |
| Homesites in Pipeline (as of 6/30/2025) | Over 24,000 | Development pipeline |
| Potential Residential Entitlements | Over 170,000 units | Bay/Walton Sector Plan |
| Q3 2025 Revenue | $161.1 million | Financial performance |
| Q3 2025 Net Income | $38.7 million | Financial performance |
Significant regulatory and permitting barriers exist, especially for large-scale projects. The Bay-Walton Sector Plan, which governs much of this development, was adopted on February 19, 2025. This plan requires new applicants to demonstrate adequate funding for infrastructure impacts, including school mitigation, and adhere to low impact development standards. Navigating this established, complex, and environmentally sensitive regulatory structure is a major time and cost sink for newcomers.
Also, established local relationships and operational footprint create a formidable barrier for outsiders. The St. Joe Company's long history and deep integration mean they have established pathways for development that new firms lack. This is reflected in their ability to generate significant recurring revenue, with leasing revenue hitting a quarterly record of $16.5 million in Q2 2025.
The barriers to entry include:
- Securing land comparable to 110,500 acres under the Sector Plan.
- Meeting infrastructure funding demands for new developments.
- Navigating the Bay-Walton Sector Plan requirements.
- Securing entitlements for over 22 million square feet of commercial space.
- Overcoming established local political and operational capital.
The sheer size of their entitled development capacity-over 170,000 residential units and 3,000 hotel rooms-means The St. Joe Company can dictate the pace and scale of development for years, effectively blocking smaller, incremental entries.
Disclaimer
All information, articles, and product details provided on this website are for general informational and educational purposes only. We do not claim any ownership over, nor do we intend to infringe upon, any trademarks, copyrights, logos, brand names, or other intellectual property mentioned or depicted on this site. Such intellectual property remains the property of its respective owners, and any references here are made solely for identification or informational purposes, without implying any affiliation, endorsement, or partnership.
We make no representations or warranties, express or implied, regarding the accuracy, completeness, or suitability of any content or products presented. Nothing on this website should be construed as legal, tax, investment, financial, medical, or other professional advice. In addition, no part of this site—including articles or product references—constitutes a solicitation, recommendation, endorsement, advertisement, or offer to buy or sell any securities, franchises, or other financial instruments, particularly in jurisdictions where such activity would be unlawful.
All content is of a general nature and may not address the specific circumstances of any individual or entity. It is not a substitute for professional advice or services. Any actions you take based on the information provided here are strictly at your own risk. You accept full responsibility for any decisions or outcomes arising from your use of this website and agree to release us from any liability in connection with your use of, or reliance upon, the content or products found herein.