
|
Johnson Service Group PLC (JSG.L) Évaluation DCF |
Entièrement Modifiable: Adapté À Vos Besoins Dans Excel Ou Sheets
Conception Professionnelle: Modèles Fiables Et Conformes Aux Normes Du Secteur
Pré-Construits Pour Une Utilisation Rapide Et Efficace
Compatible MAC/PC, entièrement débloqué
Aucune Expertise N'Est Requise; Facile À Suivre
Johnson Service Group PLC (JSG.L) Bundle
Améliorez vos stratégies d'investissement avec la calculatrice [symbole] DCF! Plongez dans le précision des services financiers de Johnson Service Group, ajustez les prédictions et les dépenses de croissance et visualisez instantanément la façon dont ces changements affectent la valeur intrinsèque [symbole].
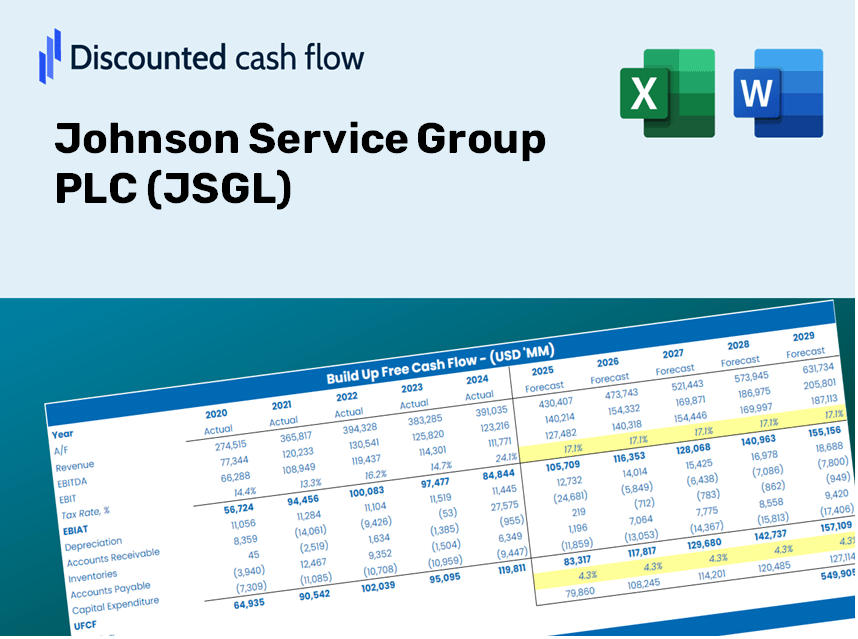
Discounted Cash Flow (DCF) - (USD MM)
| Year | AY1 2020 |
AY2 2021 |
AY3 2022 |
AY4 2023 |
AY5 2024 |
FY1 2025 |
FY2 2026 |
FY3 2027 |
FY4 2028 |
FY5 2029 |
|---|---|---|---|---|---|---|---|---|---|---|
| Revenue | 229.8 | 271.4 | 385.7 | 465.3 | 513.4 | 630.4 | 774.2 | 950.7 | 1,167.4 | 1,433.6 |
| Revenue Growth, % | 0 | 18.1 | 42.11 | 20.64 | 10.34 | 22.8 | 22.8 | 22.8 | 22.8 | 22.8 |
| EBITDA | 49.2 | 74.5 | 104.9 | 129.4 | 152.2 | 168.3 | 206.7 | 253.9 | 311.7 | 382.8 |
| EBITDA, % | 21.41 | 27.45 | 27.2 | 27.81 | 29.65 | 26.7 | 26.7 | 26.7 | 26.7 | 26.7 |
| Depreciation | 77.2 | 66.2 | 70.9 | 86.3 | 97.5 | 143.6 | 176.4 | 216.6 | 266.0 | 326.6 |
| Depreciation, % | 33.59 | 24.39 | 18.38 | 18.55 | 18.99 | 22.78 | 22.78 | 22.78 | 22.78 | 22.78 |
| EBIT | -28.0 | 8.3 | 34.0 | 43.1 | 54.7 | 24.7 | 30.4 | 37.3 | 45.8 | 56.2 |
| EBIT, % | -12.18 | 3.06 | 8.82 | 9.26 | 10.65 | 3.92 | 3.92 | 3.92 | 3.92 | 3.92 |
| Total Cash | 7.8 | 5.2 | 6.1 | 9.6 | 11.5 | 14.1 | 17.3 | 21.3 | 26.1 | 32.1 |
| Total Cash, percent | .0 | .0 | .0 | .0 | .0 | .0 | .0 | .0 | .0 | .0 |
| Account Receivables | 33.0 | 44.8 | 56.5 | 73.2 | 73.0 | 95.2 | 116.8 | 143.5 | 176.2 | 216.4 |
| Account Receivables, % | 14.36 | 16.51 | 14.65 | 15.73 | 14.22 | 15.09 | 15.09 | 15.09 | 15.09 | 15.09 |
| Inventories | 1.4 | 2.2 | 1.8 | 1.9 | 2.3 | 3.5 | 4.2 | 5.2 | 6.4 | 7.9 |
| Inventories, % | 0.60923 | 0.81061 | 0.46668 | 0.40834 | 0.44799 | 0.54857 | 0.54857 | 0.54857 | 0.54857 | 0.54857 |
| Accounts Payable | 16.8 | 25.8 | 38.5 | 40.6 | 41.1 | 54.9 | 67.4 | 82.8 | 101.6 | 124.8 |
| Accounts Payable, % | 7.31 | 9.51 | 9.98 | 8.73 | 8.01 | 8.71 | 8.71 | 8.71 | 8.71 | 8.71 |
| Capital Expenditure | -50.7 | -66.2 | -76.2 | -93.0 | -50.6 | -121.1 | -148.7 | -182.6 | -224.3 | -275.4 |
| Capital Expenditure, % | -22.06 | -24.39 | -19.76 | -19.99 | -9.86 | -19.21 | -19.21 | -19.21 | -19.21 | -19.21 |
| Tax Rate, % | 24.58 | 24.58 | 24.58 | 24.58 | 24.58 | 24.58 | 24.58 | 24.58 | 24.58 | 24.58 |
| EBITAT | -23.5 | 10.7 | 32.5 | 31.3 | 41.3 | 21.1 | 26.0 | 31.9 | 39.1 | 48.1 |
| Depreciation | ||||||||||
| Changes in Account Receivables | ||||||||||
| Changes in Inventories | ||||||||||
| Changes in Accounts Payable | ||||||||||
| Capital Expenditure | ||||||||||
| UFCF | -14.6 | 7.1 | 28.6 | 9.9 | 88.5 | 34.1 | 43.6 | 53.6 | 65.8 | 80.8 |
| WACC, % | 8.17 | 8.34 | 8.3 | 8.05 | 8.08 | 8.18 | 8.18 | 8.18 | 8.18 | 8.18 |
| PV UFCF | ||||||||||
| SUM PV UFCF | 213.7 | |||||||||
| Long Term Growth Rate, % | 2.00 | |||||||||
| Free cash flow (T + 1) | 82 | |||||||||
| Terminal Value | 1,332 | |||||||||
| Present Terminal Value | 899 | |||||||||
| Enterprise Value | 1,113 | |||||||||
| Net Debt | 116 | |||||||||
| Equity Value | 997 | |||||||||
| Diluted Shares Outstanding, MM | 418 | |||||||||
| Equity Value Per Share | 238.47 |
What You Will Receive
- Adjustable Forecast Inputs: Effortlessly modify key assumptions (growth %, margins, WACC) to develop various scenarios.
- Real-World Data: Pre-filled financial data for Johnson Service Group PLC (JSGL) to kickstart your analysis.
- Automatic DCF Outputs: The template provides calculations for Net Present Value (NPV) and intrinsic value automatically.
- Customizable and Professional Design: A sleek Excel model tailored to suit your valuation requirements.
- Designed for Analysts and Investors: Perfect for evaluating projections, validating strategies, and enhancing efficiency.
Key Features
- Pre-Loaded Data: Historical financial statements and pre-filled forecasts for Johnson Service Group PLC (JSGL).
- Fully Adjustable Inputs: Modify WACC, tax rates, revenue growth, and EBITDA margins as needed.
- Instant Results: View the intrinsic value of Johnson Service Group PLC (JSGL) recalculating in real time.
- Clear Visual Outputs: Dashboard charts present valuation results and essential metrics at a glance.
- Built for Accuracy: A professional-grade tool designed for analysts, investors, and finance professionals.
How It Functions
- Download: Obtain the pre-configured Excel file containing Johnson Service Group PLC’s (JSGL) financial information.
- Customize: Modify projections, including revenue growth, EBITDA %, and WACC.
- Update Automatically: The intrinsic value and NPV calculations refresh in real-time.
- Test Scenarios: Generate various forecasts and compare results instantly.
- Make Decisions: Leverage the valuation data to shape your investment strategy.
Why Opt for This Calculator?
- All-in-One Solution: Features DCF, WACC, and financial ratio analyses seamlessly integrated.
- Adjustable Parameters: Modify the yellow-highlighted cells to explore different scenarios.
- In-Depth Analysis: Automatically computes Johnson Service Group PLC’s (JSGL) intrinsic value and Net Present Value.
- Preloaded Information: Utilizes historical and projected data for reliable benchmarks.
- Professional Standard: Perfect for financial analysts, investors, and business consultants.
Who Can Benefit from This Product?
- Investors: Evaluate the valuation of Johnson Service Group PLC (JSGL) before making investment decisions.
- CFOs and Financial Analysts: Optimize valuation methodologies and validate financial forecasts.
- Startup Founders: Understand the valuation methods used for established companies like Johnson Service Group PLC (JSGL).
- Consultants: Create comprehensive valuation reports for clients based on industry standards.
- Students and Educators: Utilize practical data to teach and practice valuation skills.
Contents of the Template
- Historical Data: Provides Johnson Service Group PLC's (JSGL) previous financial performance and foundational forecasts.
- DCF and Levered DCF Models: Comprehensive templates designed to assess the intrinsic value of Johnson Service Group PLC (JSGL).
- WACC Sheet: Preconfigured calculations for the Weighted Average Cost of Capital.
- Editable Inputs: Customize essential variables such as growth rates, EBITDA %, and CAPEX assumptions.
- Quarterly and Annual Statements: A thorough analysis of Johnson Service Group PLC's (JSGL) financials.
- Interactive Dashboard: Engage with dynamic visualizations of valuation outcomes and forecasts.
Disclaimer
All information, articles, and product details provided on this website are for general informational and educational purposes only. We do not claim any ownership over, nor do we intend to infringe upon, any trademarks, copyrights, logos, brand names, or other intellectual property mentioned or depicted on this site. Such intellectual property remains the property of its respective owners, and any references here are made solely for identification or informational purposes, without implying any affiliation, endorsement, or partnership.
We make no representations or warranties, express or implied, regarding the accuracy, completeness, or suitability of any content or products presented. Nothing on this website should be construed as legal, tax, investment, financial, medical, or other professional advice. In addition, no part of this site—including articles or product references—constitutes a solicitation, recommendation, endorsement, advertisement, or offer to buy or sell any securities, franchises, or other financial instruments, particularly in jurisdictions where such activity would be unlawful.
All content is of a general nature and may not address the specific circumstances of any individual or entity. It is not a substitute for professional advice or services. Any actions you take based on the information provided here are strictly at your own risk. You accept full responsibility for any decisions or outcomes arising from your use of this website and agree to release us from any liability in connection with your use of, or reliance upon, the content or products found herein.