
|
Jowell Global Ltd. (JWEL) Évaluation DCF |
Entièrement Modifiable: Adapté À Vos Besoins Dans Excel Ou Sheets
Conception Professionnelle: Modèles Fiables Et Conformes Aux Normes Du Secteur
Pré-Construits Pour Une Utilisation Rapide Et Efficace
Compatible MAC/PC, entièrement débloqué
Aucune Expertise N'Est Requise; Facile À Suivre
Jowell Global Ltd. (JWEL) Bundle
Découvrez le véritable potentiel de Jowell Global Ltd. (JWEL) avec notre calculatrice DCF de niveau expert! Ajustez les hypothèses clés, explorez divers scénarios et évaluez comment les différents facteurs influencent la valorisation de Jowell Global Ltd. (JWEL) - le tout dans un modèle Excel complet.
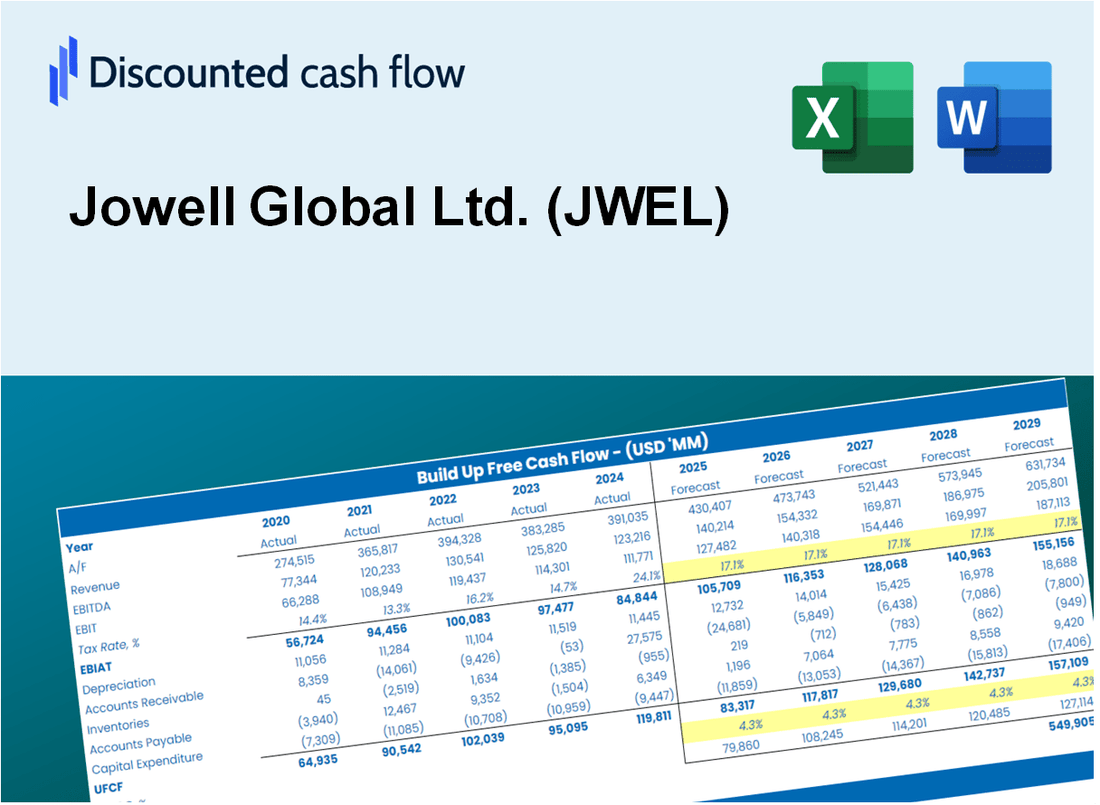
Discounted Cash Flow (DCF) - (USD MM)
| Year | AY1 2020 |
AY2 2021 |
AY3 2022 |
AY4 2023 |
AY5 2024 |
FY1 2025 |
FY2 2026 |
FY3 2027 |
FY4 2028 |
FY5 2029 |
|---|---|---|---|---|---|---|---|---|---|---|
| Revenue | 96.9 | 170.9 | 210.0 | 160.0 | 133.0 | 152.5 | 174.8 | 200.4 | 229.7 | 263.4 |
| Revenue Growth, % | 0 | 76.42 | 22.86 | -23.8 | -16.89 | 14.65 | 14.65 | 14.65 | 14.65 | 14.65 |
| EBITDA | 5.3 | -5.4 | -9.9 | -9.5 | -6.0 | -3.9 | -4.5 | -5.2 | -5.9 | -6.8 |
| EBITDA, % | 5.47 | -3.17 | -4.72 | -5.95 | -4.49 | -2.57 | -2.57 | -2.57 | -2.57 | -2.57 |
| Depreciation | .2 | 1.1 | 1.9 | 1.8 | 2.0 | 1.3 | 1.5 | 1.7 | 2.0 | 2.3 |
| Depreciation, % | 0.18835 | 0.62373 | 0.91502 | 1.12 | 1.48 | 0.86541 | 0.86541 | 0.86541 | 0.86541 | 0.86541 |
| EBIT | 5.1 | -6.5 | -11.8 | -11.3 | -7.9 | -5.2 | -6.0 | -6.9 | -7.9 | -9.1 |
| EBIT, % | 5.28 | -3.8 | -5.64 | -7.07 | -5.97 | -3.44 | -3.44 | -3.44 | -3.44 | -3.44 |
| Total Cash | 18.2 | 21.2 | 16.7 | 1.3 | 2.2 | 12.7 | 14.6 | 16.7 | 19.1 | 21.9 |
| Total Cash, percent | .0 | .0 | .0 | .0 | .0 | .0 | .0 | .0 | .0 | .0 |
| Account Receivables | 1.0 | 5.4 | 6.5 | 2.4 | 2.0 | 3.2 | 3.6 | 4.2 | 4.8 | 5.5 |
| Account Receivables, % | 1.02 | 3.19 | 3.09 | 1.53 | 1.54 | 2.07 | 2.07 | 2.07 | 2.07 | 2.07 |
| Inventories | 10.1 | 17.5 | 35.0 | 21.6 | 8.3 | 17.4 | 20.0 | 22.9 | 26.2 | 30.1 |
| Inventories, % | 10.43 | 10.26 | 16.68 | 13.49 | 6.27 | 11.43 | 11.43 | 11.43 | 11.43 | 11.43 |
| Accounts Payable | 6.3 | 7.4 | 8.1 | 4.0 | 2.4 | 5.8 | 6.6 | 7.6 | 8.7 | 10.0 |
| Accounts Payable, % | 6.47 | 4.32 | 3.88 | 2.47 | 1.79 | 3.79 | 3.79 | 3.79 | 3.79 | 3.79 |
| Capital Expenditure | -.1 | -2.0 | -1.3 | .0 | -.1 | -.6 | -.7 | -.8 | -.9 | -1.1 |
| Capital Expenditure, % | -0.12051 | -1.16 | -0.63729 | -0.01056814 | -0.09321638 | -0.40486 | -0.40486 | -0.40486 | -0.40486 | -0.40486 |
| Tax Rate, % | 0.13053 | 0.13053 | 0.13053 | 0.13053 | 0.13053 | 0.13053 | 0.13053 | 0.13053 | 0.13053 | 0.13053 |
| EBITAT | 3.6 | -6.3 | -11.4 | -11.4 | -7.9 | -4.9 | -5.6 | -6.4 | -7.3 | -8.4 |
| Depreciation | ||||||||||
| Changes in Account Receivables | ||||||||||
| Changes in Inventories | ||||||||||
| Changes in Accounts Payable | ||||||||||
| Capital Expenditure | ||||||||||
| UFCF | -1.2 | -18.0 | -28.6 | 3.7 | 6.0 | -11.0 | -6.9 | -8.0 | -9.1 | -10.5 |
| WACC, % | 6.25 | 6.59 | 6.58 | 6.62 | 6.62 | 6.53 | 6.53 | 6.53 | 6.53 | 6.53 |
| PV UFCF | ||||||||||
| SUM PV UFCF | -37.7 | |||||||||
| Long Term Growth Rate, % | 2.00 | |||||||||
| Free cash flow (T + 1) | -11 | |||||||||
| Terminal Value | -235 | |||||||||
| Present Terminal Value | -171 | |||||||||
| Enterprise Value | -209 | |||||||||
| Net Debt | 0 | |||||||||
| Equity Value | -209 | |||||||||
| Diluted Shares Outstanding, MM | 2 | |||||||||
| Equity Value Per Share | -96.30 |
What You Will Receive
- Comprehensive Financial Model: Jowell Global Ltd.'s (JWEL) real data facilitates accurate DCF valuation.
- Complete Forecast Control: Modify revenue growth, profit margins, WACC, and other essential metrics.
- Real-Time Calculations: Automatic updates provide immediate results as adjustments are made.
- Professional-Grade Template: A polished Excel file crafted for high-quality valuation presentations.
- Flexible and Reusable: Designed for adaptability, allowing for repeated use in in-depth forecasting.
Key Features
- 🔍 Real-Life JWEL Financials: Pre-filled historical and projected data for Jowell Global Ltd.
- ✏️ Fully Customizable Inputs: Adjust all critical parameters (yellow cells) like WACC, growth %, and tax rates.
- 📊 Professional DCF Valuation: Built-in formulas calculate Jowell's intrinsic value using the Discounted Cash Flow method.
- ⚡ Instant Results: Visualize Jowell's valuation instantly after making changes.
- Scenario Analysis: Test and compare outcomes for various financial assumptions side-by-side.
How It Works
- Step 1: Download the prebuilt Excel template featuring Jowell Global Ltd. (JWEL) data.
- Step 2: Navigate through the pre-filled sheets to familiarize yourself with the essential metrics.
- Step 3: Modify forecasts and assumptions in the editable yellow cells (WACC, growth, margins).
- Step 4: Instantly see the updated results, including Jowell Global Ltd.'s (JWEL) intrinsic value.
- Step 5: Make informed investment choices or create reports based on the generated outputs.
Why Choose Jowell Global Ltd. (JWEL)?
- Save Time: Quickly access financial insights without building complex models from scratch.
- Enhance Accuracy: Dependable data and methodologies minimize valuation errors.
- Completely Customizable: Adjust the framework to align with your specific forecasts and assumptions.
- User-Friendly: Intuitive visuals and outputs simplify the analysis of results.
- Endorsed by Professionals: Crafted for experts who prioritize both precision and functionality.
Who Should Use This Product?
- Investors: Evaluate Jowell Global Ltd.'s (JWEL) market position before making investment decisions.
- CFOs and Financial Analysts: Enhance valuation methodologies and assess financial forecasts.
- Startup Founders: Understand the valuation strategies of established companies like Jowell Global Ltd. (JWEL).
- Consultants: Provide comprehensive valuation assessments for clients focusing on Jowell Global Ltd. (JWEL).
- Students and Educators: Utilize current data to learn and teach valuation practices related to Jowell Global Ltd. (JWEL).
What the Template Contains
- Operating and Balance Sheet Data: Pre-filled Jowell Global Ltd. (JWEL) historical data and forecasts, including revenue, EBITDA, EBIT, and capital expenditures.
- WACC Calculation: A dedicated sheet for Weighted Average Cost of Capital (WACC), including parameters like Beta, risk-free rate, and share price.
- DCF Valuation (Unlevered and Levered): Editable Discounted Cash Flow models showing intrinsic value with detailed calculations.
- Financial Statements: Pre-loaded financial statements (annual and quarterly) to support analysis.
- Key Ratios: Includes profitability, leverage, and efficiency ratios for Jowell Global Ltd. (JWEL).
- Dashboard and Charts: Visual summary of valuation outputs and assumptions to analyze results easily.
Disclaimer
All information, articles, and product details provided on this website are for general informational and educational purposes only. We do not claim any ownership over, nor do we intend to infringe upon, any trademarks, copyrights, logos, brand names, or other intellectual property mentioned or depicted on this site. Such intellectual property remains the property of its respective owners, and any references here are made solely for identification or informational purposes, without implying any affiliation, endorsement, or partnership.
We make no representations or warranties, express or implied, regarding the accuracy, completeness, or suitability of any content or products presented. Nothing on this website should be construed as legal, tax, investment, financial, medical, or other professional advice. In addition, no part of this site—including articles or product references—constitutes a solicitation, recommendation, endorsement, advertisement, or offer to buy or sell any securities, franchises, or other financial instruments, particularly in jurisdictions where such activity would be unlawful.
All content is of a general nature and may not address the specific circumstances of any individual or entity. It is not a substitute for professional advice or services. Any actions you take based on the information provided here are strictly at your own risk. You accept full responsibility for any decisions or outcomes arising from your use of this website and agree to release us from any liability in connection with your use of, or reliance upon, the content or products found herein.