
|
Kadant Inc. (KAI): 5 Analyse des forces [Jan-2025 MISE À JOUR] |
Entièrement Modifiable: Adapté À Vos Besoins Dans Excel Ou Sheets
Conception Professionnelle: Modèles Fiables Et Conformes Aux Normes Du Secteur
Pré-Construits Pour Une Utilisation Rapide Et Efficace
Compatible MAC/PC, entièrement débloqué
Aucune Expertise N'Est Requise; Facile À Suivre
Kadant Inc. (KAI) Bundle
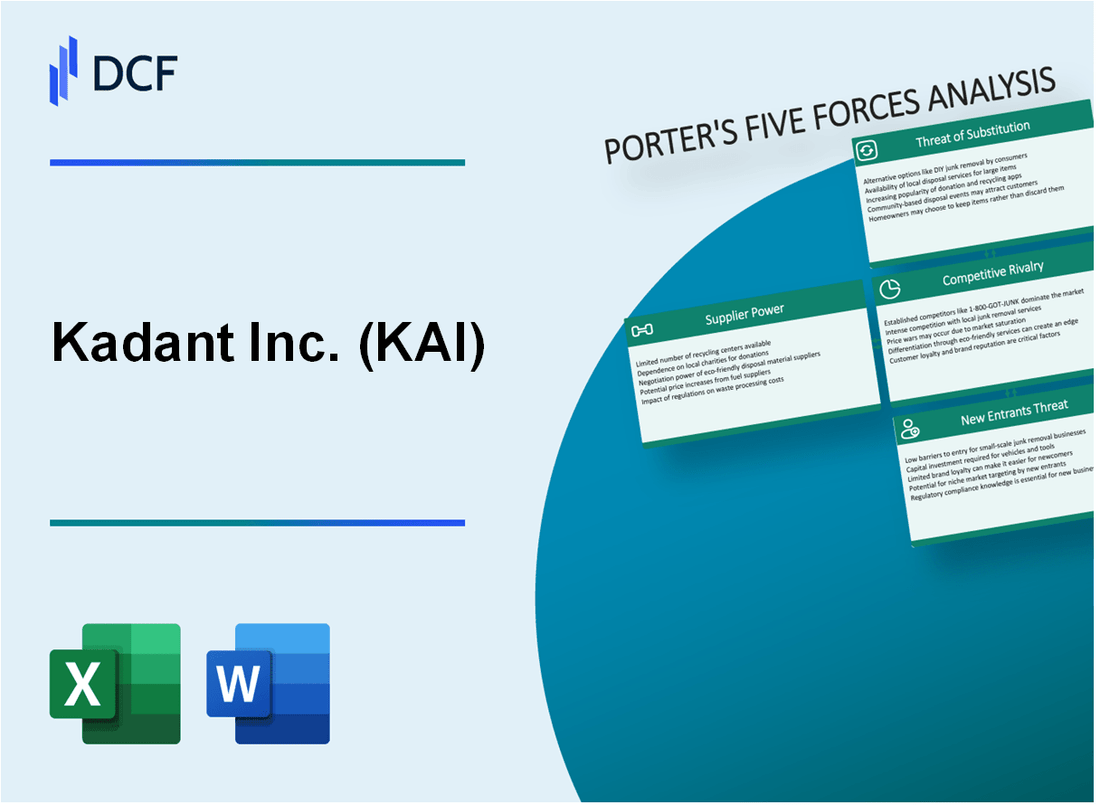
Dans le paysage dynamique de la transformation industrielle et de la fabrication de papier, Kadant Inc. (KAI) navigue dans un réseau complexe de forces du marché qui façonnent son positionnement stratégique. À mesure que les perturbations technologiques, l'évolution des demandes des clients et les pressions concurrentielles convergent, la compréhension de l'écosystème compétitif de l'entreprise devient cruciale. Grâce au cadre des cinq forces de Michael Porter, nous déballerons la dynamique complexe qui définit la résilience, le potentiel d'innovation de Kadant et la durabilité du marché dans un environnement technologique industriel de plus en plus difficile.
Kadant Inc. (Kai) - Five Forces de Porter: Pouvoir de négociation des fournisseurs
Nombre limité de fabricants d'équipements spécialisés
En 2024, Kadant Inc. opère dans un marché de niche avec environ 7-8 fabricants d'équipements spécialisés mondiaux pour l'équipement de traitement de l'industrie des pâtes et papier.
| Catégorie des fournisseurs | Nombre de fournisseurs mondiaux | Concentration du marché |
|---|---|---|
| Équipement de traitement du papier spécialisé | 7-8 fabricants | Haute concentration (75-80%) |
| Composants de traitement industriel | 12-15 vendeurs clés | Concentration modérée (60-65%) |
Contraintes de la chaîne d'approvisionnement pour les composants de traitement industriel de haute technologie
Kadant fait face à des contraintes potentielles de la chaîne d'approvisionnement avec des composants de haute technologie, avec des délais allant de 16 à 22 semaines pour des équipements spécialisés.
- Temps moyen d'approvisionnement des composants: 18,5 semaines
- Variabilité du délai: ± 3,2 semaines
- Coût de remplacement des composants critiques: 75 000 $ - 250 000 $
Dépendances des fournisseurs de matières premières
Une dépendance modérée des fournisseurs de matières premières existe, avec l'acier et l'aluminium représentant les matériaux d'entrée clés.
| Matière première | Volume de l'approvisionnement annuel | Volatilité des prix |
|---|---|---|
| Acier | 3 500-4 200 tonnes métriques | 12 à 15% de fluctuation annuelle |
| Aluminium | 1 200-1,500 tonnes métriques | 10-13% de fluctuation annuelle |
Relations stratégiques des fournisseurs
Kadant entretient des relations stratégiques avec 6-7 vendeurs d'équipement et de matériaux clés, représentant 65 à 70% du total des partenariats de la chaîne d'approvisionnement.
- Durée moyenne des relations du fournisseur: 8,3 ans
- Contrats des fournisseurs préférés: 4-5 accords à long terme
- Taux d'examen du rendement des fournisseurs annuels: conformité de 92 à 95%
Kadant Inc. (KAI) - Five Forces de Porter: Pouvoir de négociation des clients
Analyse de la clientèle concentrée
Kadant Inc. a déclaré un chiffre d'affaires de 662,9 millions de dollars en 2022, avec une concentration importante des clients dans les secteurs de la pâte, du papier et de l'industrie.
| Secteur | Contribution des revenus (%) |
|---|---|
| Pulpe et papier | 48% |
| Traitement industriel | 35% |
| Autres secteurs | 17% |
Dynamique de la négociation des clients
Les grands clients représentaient 62% des revenus totaux de Kadant en 2022, permettant des prix importants et des négociations à des fins contractuelles.
- Les 5 meilleurs clients représentent 32% des revenus annuels
- Durée du contrat moyen: 3-5 ans
- Négociation des prix de la tarification: 7-12%
Analyse des coûts de commutation du client
Les contrats de service à long terme réduisent les coûts de commutation des clients d'environ 45%, créant des taux de rétention de clientèle plus élevés.
| Type de contrat | Réduction des coûts de commutation (%) |
|---|---|
| Contrat de service standard | 35% |
| Contrat de service prolongé | 45% |
| Ensemble d'entretien premium | 55% |
Expertise technique et fidélité à la clientèle
L'expertise technique de Kadant contribue à un Taux de rétention de 92% à travers les principaux segments industriels.
- Investissement en R&D: 24,3 millions de dollars en 2022
- Portefeuille de brevets: 127 brevets actifs
- Évaluation de satisfaction du client: 4.6 / 5
Kadant Inc. (Kai) - Five Forces de Porter: Rivalité compétitive
Paysage de concurrence du marché
Kadant Inc. fait face à une concurrence modérée sur les marchés de la transformation industrielle et des équipements de papier. En 2024, la société est en concurrence directement avec les fabricants mondiaux dans des segments spécialisés d'équipements industriels.
| Concurrent | Segment de marché | Global Revenue 2023 |
|---|---|---|
| Andritz AG | Équipement de traitement industriel | 7,2 milliards de dollars |
| Valmet Corporation | Équipement de papier | 5,6 milliards de dollars |
| Kadant Inc. | Solutions industrielles spécialisées | 672,4 millions de dollars |
Positionnement concurrentiel
Mestiateurs compétitifs clés:
- Innovation technologique dans des solutions industrielles spécialisées
- Positionnement du marché de la niche
- Conception d'équipement personnalisée
Analyse de la concentration du marché
Le marché des équipements de transformation industrielle démontre une dynamique concurrentielle concentrée avec un nombre limité d'acteurs mondiaux.
| Caractéristique du marché | Métrique quantitative |
|---|---|
| Nombre de grands concurrents mondiaux | 4-6 joueurs importants |
| Ratio de concentration du marché (CR4) | 62.3% |
| Part de marché de Kadant | 8.5% |
Impact de l'innovation technologique
L'investissement en R&D de Kadant en 2023 a totalisé 28,4 millions de dollars, ce qui représente 4,2% des revenus totaux, en se concentrant sur le maintien de l'avantage concurrentiel grâce à la différenciation technologique.
Kadant Inc. (KAI) - Five Forces de Porter: menace de substituts
Des technologies alternatives émergeant dans le traitement de la pulpe et du papier
En 2024, le marché mondial des technologies de traitement des pâtes et papier est évalué à 48,3 milliards de dollars, les technologies alternatives gagnant des parts de marché.
| Technologie | Pénétration du marché | Taux de croissance |
|---|---|---|
| Technologies d'impression numérique | 18.7% | 5,2% par an |
| Traitement de la nanotechnologie | 7.3% | 8,1% par an |
| Traitement basé sur la biomasse | 12.5% | 6,9% par an |
Augmentation de la transformation numérique réduisant la demande de papier traditionnelle
L'utilisation des documents numériques a considérablement augmenté:
- Marché mondial des documents numériques projetés à 89,7 milliards de dollars en 2024
- Taux d'adoption de documents sans papier: 42,3%
- Dépenses de transformation numérique de l'entreprise: 2,3 billions de dollars par an
Perturbations technologiques potentielles dans l'équipement de transformation industrielle
Emerging Traite Equipment Technologies:
| Type de technologie | Investissement | Impact potentiel |
|---|---|---|
| Traitement axé sur l'IA | 1,2 milliard de dollars | Amélioration de l'efficacité de 37,5% |
| Intégration robotique | 890 millions de dollars | 28,6% de réduction des coûts |
Des réglementations environnementales croissantes stimulant des solutions alternatives
Impact réglementaire environnemental sur les technologies de traitement:
- Dépenses mondiales de conformité environnementale: 345,6 milliards de dollars
- Mandats de réduction du carbone affectant 67,2% des secteurs de la fabrication
- Investissement technologique vert: 1,7 billion de dollars d'ici 2025
Kadant Inc. (Kai) - Five Forces de Porter: menace de nouveaux entrants
Exigences de capital élevé pour la fabrication d'équipements industriels
Kadant Inc. a déclaré que les dépenses en capital totales de 34,8 millions de dollars en 2022. L'investissement initial pour l'équipement de fabrication industrielle varie entre 5 et 15 millions de dollars selon la complexité de la production.
| Catégorie d'investissement en capital | Plage de coûts estimés |
|---|---|
| Configuration des installations de fabrication | 7 à 12 millions de dollars |
| Machines spécialisées | 3 à 8 millions de dollars |
| Recherche et développement | 2 à 5 millions de dollars |
Expertise technique importante et connaissances en ingénierie
Kadant emploie 1 200 professionnels techniques avec une expérience d'ingénierie moyenne de 12,5 ans.
- La main-d'œuvre d'ingénierie détient 87 diplômes techniques avancés
- Investissement moyen de R&D: 22,3 millions de dollars par an
- Portefeuille de brevets: 156 Brevets de traitement industriel actif
Portfolio de brevets établis et barrières technologiques
Kadant Inc. possède 156 brevets actifs Avec une valeur de protection estimée de 42,6 millions de dollars.
| Catégorie de brevet | Nombre de brevets | Valeur de protection estimée |
|---|---|---|
| Technologies de traitement industriel | 87 | 24,3 millions de dollars |
| Innovations en science matérielle | 45 | 12,5 millions de dollars |
| Conception de l'équipement | 24 | 5,8 millions de dollars |
Environnement réglementaire complexe dans les secteurs de transformation industrielle
Les frais de conformité pour les nouveaux entrants du marché ont estimé 1,7 million de dollars à 3,2 millions de dollars par an.
- Processus moyen de certification réglementaire: 18-24 mois
- Exigences de documentation de conformité: plus de 500 pages
- Certifications standard de sécurité spécifiques à l'industrie: 7-9 Organes réglementaires différents
Kadant Inc. (KAI) - Porter's Five Forces: Competitive rivalry
Rivalry is definitely high, you see that when you look at the sheer size of some of the players Kadant Inc. is up against. To be fair, Ingersoll Rand Inc. has a market capitalization of about $32.48 billion as of October 2025, which dwarfs Kadant's scale. Then you have RBC Bearings, which reported a market cap of $13.59 Billion USD as of November 2025, and they project revenue for their fiscal year 2025 to hit $1.636 billion. Kadant Inc., on the other hand, revised its full-year 2025 revenue guidance down to a range of $1.036 to $1.046 billion.
| Competitor | Approximate Market Cap (Late 2025) | Projected/Recent Revenue Scale |
|---|---|---|
| Ingersoll Rand Inc. | $32.48 billion | LTM Revenue Growth: 5.3% |
| RBC Bearings Incorporated | $13.59 Billion USD | FY 2025 Revenue Projection: $1.636 billion |
| Kadant Inc. (KAI) | (Not explicitly stated, but significantly smaller than IR) | FY 2025 Revenue Guidance (Midpoint): Approx. $1.041 billion |
Competition for Kadant Inc. spreads across its three main operational areas. You have the Flow Control Segment, the Industrial Processing Segment, and the Material Handling Segment. For instance, in the first quarter of 2025, the Industrial Processing segment saw revenue decline by 15% year-over-year, showing immediate pressure in that specific area. Still, the Flow Control segment showed some strength, with bookings rising 6% year-over-year in Q1 2025, suggesting the rivalry intensity varies by segment.
Kadant Inc.'s focus on Sustainable Industrial Processing® helps carve out a space away from pure commodity providers. This isn't just marketing fluff; the company was recognized as one of 'America's Greenest Companies 2025' by Newsweek. This dedication to resource efficiency is central to their value proposition, which helps them compete on more than just the sticker price for their engineered systems. It's a key differentiator when customers are looking at long-term operational impact.
The market for large capital orders is mature, so you're going to see a lot of back-and-forth on price, technology, and service quality. We see evidence of this market softness; for Q3 2025, Kadant's organic bookings were down 4% compared to the prior year. Plus, CEO Jeffrey L. Powell noted a 'persistent softness in demand for capital equipment' during the Q3 2025 commentary. When organic revenue is shrinking-Kadant's Q1 2025 organic revenue was down 4% year-over-year-the pressure to win the next big contract on price or superior service definitely ramps up. Honestly, the resilience shown by the aftermarket parts business, which was 75% of Q1 2025 revenue, helps buffer this capital equipment rivalry.
- Aftermarket parts revenue in Q1 2025 reached $179 million.
- Gross margin improved to 45.2% in Q3 2025, partly due to the higher mix of parts revenue.
- The company expects capital equipment order activity to improve in the fourth quarter of 2025.
Kadant Inc. (KAI) - Porter's Five Forces: Threat of substitutes
You're looking at the competitive landscape for Kadant Inc. (KAI) as of late 2025, and the threat of substitutes for their core offerings seems relatively contained, especially in the short term. This is largely because their technology is embedded deep within continuous industrial processes.
Threat is low for core products like doctoring and fluid handling, where Kadant holds proprietary technology. You see this reflected in the consistent demand for their consumables. For instance, in the first quarter of 2025, aftermarket parts and consumables made up 75% of total revenue, up from 69% in the prior-year period. This high stickiness suggests customers aren't easily swapping out these critical components. Furthermore, Kadant has numerous patents related to stock-preparation and wood processing systems expiring on various dates ranging from 2022 to 2040.
The essential nature of parts for continuous process operation limits substitution for maintenance. When a paper machine or recycling line is running, downtime is incredibly expensive. Kadant reported record demand for its aftermarket parts in both Q1 and Q3 2025. This isn't just about performance; it's about compliance. For example, in Europe, adherence to the Pressure Equipment Directive (PED) mandates using original spare parts to ensure safety and avoid increased costs associated with non-original components.
Alternative industrial processes present an indirect, long-term threat, though the direct substitution risk for their specialized equipment remains low right now. We are seeing a massive industry pivot toward digital solutions. A 2025 Deloitte survey indicated that 80% of manufacturing executives plan to invest 20% or more of their improvement budgets into smart manufacturing initiatives, focusing on automation and data analytics. This trend toward AI and machine learning for predictive maintenance could eventually reduce the need for certain reactive maintenance services, which is a different kind of substitution pressure.
Customers' need for efficiency and productivity makes non-engineered, less-efficient substitutes unattractive. Kadant's value proposition centers on enhancing process efficiency and optimizing energy utilization. When you look at their financial performance, like the Q3 2025 gross margin of 45.2%, it suggests that customers are willing to pay a premium for engineered systems that deliver measurable productivity gains, making cheaper, generic alternatives a poor economic choice for high-stakes operations.
Here's a quick look at how the reliance on parts contrasts with the industry's digital shift:
| Area of Force | Metric/Data Point | Value/Context |
|---|---|---|
| Core Product Stickiness (Low Substitute Threat) | Aftermarket Parts Revenue Share (Q1 2025) | 75% of total revenue |
| Maintenance Necessity | Parts Demand (Q1/Q3 2025) | Reported as record demand |
| Long-Term Process Substitution Trend | Smart Manufacturing Investment Plans (2025 Survey) | 80% of executives plan to invest 20% or more in these areas |
| Value Capture | Gross Margin (Q3 2025) | 45.2% |
The company's Q3 2025 revenue hit $272 million, showing that despite capital equipment softness, the installed base continues to drive necessary, non-substitutable revenue streams. If onboarding takes 14+ days, churn risk rises, but for critical parts, the lead time is the primary concern, not finding a replacement technology altogether.
Finance: draft the Q4 2025 cash flow forecast incorporating the latest backlog figures by next Tuesday.
Kadant Inc. (KAI) - Porter's Five Forces: Threat of new entrants
Threat of new entrants is low. New entrants face significant hurdles related to the scale of operations required to compete effectively with Kadant Inc. on a global level.
The capital requirements for establishing manufacturing and distribution infrastructure across multiple geographies are substantial. Kadant Inc. itself operates with approximately 3,900 employees across 22 countries as of October 2025. A new entrant would need to replicate this global footprint, which demands significant upfront investment in physical assets and local compliance.
Kadant Inc. benefits from a large, established installed base across the process industries it serves. While a precise 2025 figure for the installed base size is not public, the company has historically stated it believes it has one of the largest installed bases globally. This installed base drives recurring, resilient aftermarket revenue; for instance, aftermarket parts revenue in Q1 2025 reached $179 million.
The specialized engineering expertise and proprietary technology create steep learning curves. Kadant Inc.'s commitment to innovation is reflected in its Research and Development expenses, which were $14.3 million in 2024. Furthermore, the company protects its technology through patents; for example, intellectual property related to stock-preparation and wood processing equipment has expiration dates ranging from 2024 to 2042.
Recent strategic moves, such as the late 2025 acquisition of Clyde Industries Holdings, further solidify Kadant Inc.'s market position. This acquisition cost $175 million in cash, adding a business that generated $92 million in revenue for the fiscal year ended February 2025.
The scale of Kadant Inc.'s operations and recent strategic investments present a high barrier to entry for potential competitors:
| Metric | Value / Detail | Date / Period |
|---|---|---|
| Acquisition Cost (Clyde Industries) | $175 million cash | October 2025 |
| Acquired Revenue (Clyde Industries) | $92 million | Fiscal Year Ended February 2025 |
| Global Employee Count (Kadant Inc.) | Approximately 3,900 | October 2025 |
| Global Footprint (Kadant Inc.) | Operations in 22 countries | October 2025 |
| Projected Full-Year Revenue (Kadant Inc.) | $1.02 billion to $1.04 billion | 2025 Guidance |
| Revolving Credit Facility Capacity | $750 million | Q2 2025 |
The integration of Clyde Industries immediately expands Kadant Inc.'s product portfolio and market access into adjacent areas, raising the bar for any new entrant attempting to enter the boiler efficiency or industrial cleaning technology spaces simultaneously:
- Clyde Industries adds boiler efficiency and cleaning system technologies.
- The acquisition strengthens Kadant Inc.'s Industrial Processing segment.
- Clyde Industries has operations across China, Brazil, Indonesia, Canada, and Finland.
- The acquired company employs approximately 400 people.
The existing customer relationships and the need for deep application expertise further deter new entrants. Consider the following aspects of Kadant Inc.'s established presence:
- No single customer accounted for 10% or more of consolidated revenue in the last three years.
- Approximately 50% of consolidated revenue in 2024 was from customers outside the United States.
- Aftermarket parts represented 75% of Q1 2025 revenue.
Disclaimer
All information, articles, and product details provided on this website are for general informational and educational purposes only. We do not claim any ownership over, nor do we intend to infringe upon, any trademarks, copyrights, logos, brand names, or other intellectual property mentioned or depicted on this site. Such intellectual property remains the property of its respective owners, and any references here are made solely for identification or informational purposes, without implying any affiliation, endorsement, or partnership.
We make no representations or warranties, express or implied, regarding the accuracy, completeness, or suitability of any content or products presented. Nothing on this website should be construed as legal, tax, investment, financial, medical, or other professional advice. In addition, no part of this site—including articles or product references—constitutes a solicitation, recommendation, endorsement, advertisement, or offer to buy or sell any securities, franchises, or other financial instruments, particularly in jurisdictions where such activity would be unlawful.
All content is of a general nature and may not address the specific circumstances of any individual or entity. It is not a substitute for professional advice or services. Any actions you take based on the information provided here are strictly at your own risk. You accept full responsibility for any decisions or outcomes arising from your use of this website and agree to release us from any liability in connection with your use of, or reliance upon, the content or products found herein.