
|
Kaynes Technology India Limited (Kaynes.NS) Évaluation DCF |
Entièrement Modifiable: Adapté À Vos Besoins Dans Excel Ou Sheets
Conception Professionnelle: Modèles Fiables Et Conformes Aux Normes Du Secteur
Pré-Construits Pour Une Utilisation Rapide Et Efficace
Compatible MAC/PC, entièrement débloqué
Aucune Expertise N'Est Requise; Facile À Suivre
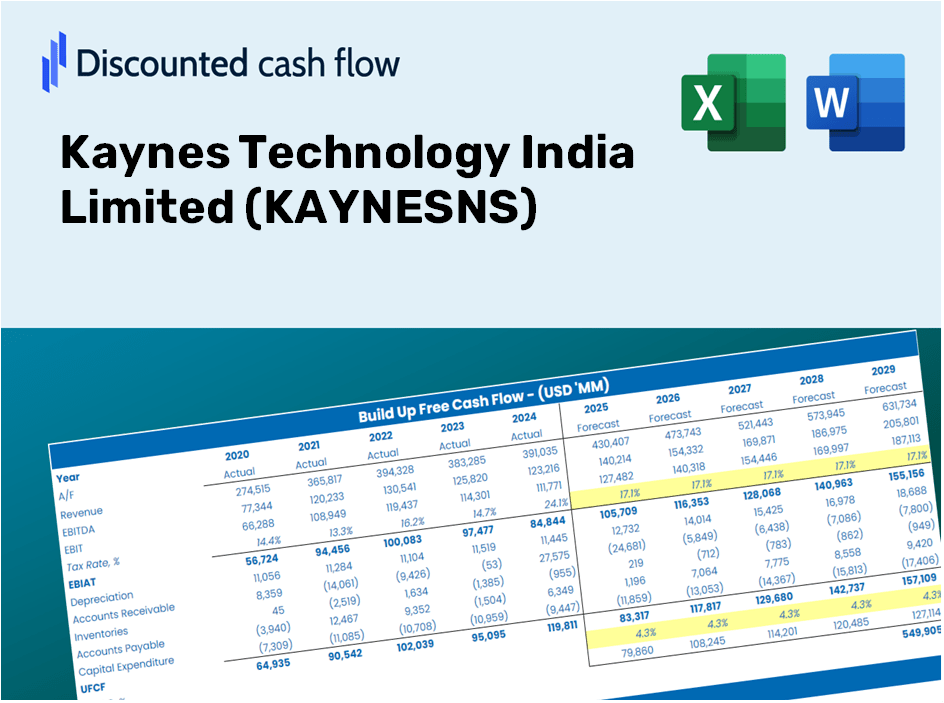
Kaynes Technology India Limited (KAYNES.NS) Bundle
Améliorez vos stratégies d'investissement avec la calculatrice (Kaynesns) DCF! Utilisez des données financières réelles de Kaynes Technology India Limited, ajustez les prévisions et dépenses de croissance et observez instantanément comment ces modifications affectent la valeur intrinsèque de (Kaynesns).
Discounted Cash Flow (DCF) - (USD MM)
| Year | AY1 2021 |
AY2 2022 |
AY3 2023 |
AY4 2024 |
AY5 2025 |
FY1 2026 |
FY2 2027 |
FY3 2028 |
FY4 2029 |
FY5 2030 |
|---|---|---|---|---|---|---|---|---|---|---|
| Revenue | 4,206.3 | 7,062.5 | 11,261.1 | 18,046.2 | 27,217.5 | 43,441.0 | 69,334.8 | 110,663.1 | 176,625.8 | 281,906.7 |
| Revenue Growth, % | 0 | 67.9 | 59.45 | 60.25 | 50.82 | 59.61 | 59.61 | 59.61 | 59.61 | 59.61 |
| EBITDA | 461.1 | 992.8 | 1,812.6 | 3,124.6 | 4,107.0 | 6,387.6 | 10,195.1 | 16,272.0 | 25,971.2 | 41,451.9 |
| EBITDA, % | 10.96 | 14.06 | 16.1 | 17.31 | 15.09 | 14.7 | 14.7 | 14.7 | 14.7 | 14.7 |
| Depreciation | 100.8 | 131.6 | 187.4 | 251.4 | 447.4 | 778.5 | 1,242.5 | 1,983.1 | 3,165.2 | 5,051.9 |
| Depreciation, % | 2.4 | 1.86 | 1.66 | 1.39 | 1.64 | 1.79 | 1.79 | 1.79 | 1.79 | 1.79 |
| EBIT | 360.4 | 861.2 | 1,625.2 | 2,873.2 | 3,659.6 | 5,609.1 | 8,952.5 | 14,288.9 | 22,806.0 | 36,399.9 |
| EBIT, % | 8.57 | 12.19 | 14.43 | 15.92 | 13.45 | 12.91 | 12.91 | 12.91 | 12.91 | 12.91 |
| Total Cash | 118.3 | 164.0 | 4,819.1 | 15,194.1 | 10,466.8 | 14,820.4 | 23,654.4 | 37,754.0 | 60,257.9 | 96,175.7 |
| Total Cash, percent | .0 | .0 | .0 | .0 | .0 | .0 | .0 | .0 | .0 | .0 |
| Account Receivables | 1,241.6 | 2,000.6 | 2,391.7 | 3,560.9 | 5,794.3 | 10,434.9 | 16,654.8 | 26,582.2 | 42,427.1 | 67,716.5 |
| Account Receivables, % | 29.52 | 28.33 | 21.24 | 19.73 | 21.29 | 24.02 | 24.02 | 24.02 | 24.02 | 24.02 |
| Inventories | 1,638.7 | 2,263.8 | 4,434.8 | 5,956.3 | 8,144.2 | 15,058.5 | 24,034.4 | 38,360.5 | 61,226.0 | 97,720.8 |
| Inventories, % | 38.96 | 32.05 | 39.38 | 33.01 | 29.92 | 34.66 | 34.66 | 34.66 | 34.66 | 34.66 |
| Accounts Payable | 954.3 | 1,640.6 | 2,228.7 | 3,610.1 | 6,829.2 | 9,626.9 | 15,365.3 | 24,524.0 | 39,142.0 | 62,473.2 |
| Accounts Payable, % | 22.69 | 23.23 | 19.79 | 20 | 25.09 | 22.16 | 22.16 | 22.16 | 22.16 | 22.16 |
| Capital Expenditure | -250.0 | -422.4 | -581.2 | -3,826.0 | -9,487.5 | -6,354.9 | -10,142.9 | -16,188.7 | -25,838.3 | -41,239.6 |
| Capital Expenditure, % | -5.94 | -5.98 | -5.16 | -21.2 | -34.86 | -14.63 | -14.63 | -14.63 | -14.63 | -14.63 |
| Tax Rate, % | 21.04 | 21.04 | 21.04 | 21.04 | 21.04 | 21.04 | 21.04 | 21.04 | 21.04 | 21.04 |
| EBITAT | 322.6 | 604.7 | 1,227.5 | 2,274.1 | 2,889.6 | 4,413.1 | 7,043.5 | 11,242.0 | 17,942.9 | 28,638.1 |
| Depreciation | ||||||||||
| Changes in Account Receivables | ||||||||||
| Changes in Inventories | ||||||||||
| Changes in Accounts Payable | ||||||||||
| Capital Expenditure | ||||||||||
| UFCF | -1,752.5 | -384.0 | -1,140.3 | -2,609.7 | -7,352.7 | -9,920.5 | -11,314.3 | -18,058.4 | -28,822.4 | -46,002.5 |
| WACC, % | 4.76 | 4.72 | 4.73 | 4.74 | 4.74 | 4.74 | 4.74 | 4.74 | 4.74 | 4.74 |
| PV UFCF | ||||||||||
| SUM PV UFCF | -95,946.5 | |||||||||
| Long Term Growth Rate, % | 4.00 | |||||||||
| Free cash flow (T + 1) | -47,843 | |||||||||
| Terminal Value | -6,473,408 | |||||||||
| Present Terminal Value | -5,135,580 | |||||||||
| Enterprise Value | -5,231,527 | |||||||||
| Net Debt | -1,533 | |||||||||
| Equity Value | -5,229,993 | |||||||||
| Diluted Shares Outstanding, MM | 65 | |||||||||
| Equity Value Per Share | -80,918.31 |
What You Will Receive
- Customizable Excel Template: A fully adaptable Excel-based DCF Calculator featuring pre-filled financial data for KAYNES Technology India Limited (KAYNESNS).
- Authentic Data: Access to historical figures and forward-looking estimates (displayed in the highlighted cells).
- Adjustable Forecasts: Modify key assumptions such as revenue growth, EBITDA percentage, and WACC.
- Instant Calculations: Quickly observe how your input affects the valuation of KAYNES Technology India Limited (KAYNESNS).
- Professional Resource: Designed for investors, CFOs, consultants, and financial analysts.
- User-Friendly Layout: Organized for simplicity and ease of navigation, accompanied by comprehensive instructions.
Key Features
- Comprehensive DCF Calculator: Features extensive unlevered and levered DCF valuation models tailored for Kaynes Technology India Limited (KAYNESNS).
- WACC Calculator: Provides a pre-configured Weighted Average Cost of Capital sheet with the option for customizable parameters.
- Adjustable Forecast Assumptions: Easily alter growth projections, capital expenditures, and discount rates as needed.
- Integrated Financial Ratios: Evaluate profitability, leverage, and efficiency ratios specific to Kaynes Technology India Limited (KAYNESNS).
- User-Friendly Dashboard and Charts: Visual presentations summarize critical valuation metrics for straightforward analysis.
How It Operates
- Obtain the Template: Gain immediate access to the Excel-based KAYNES DCF Calculator.
- Enter Your Assumptions: Modify the yellow-highlighted cells for growth rates, WACC, margins, and other relevant inputs.
- Instant Calculations: The model will automatically recalculate the intrinsic value of Kaynes Technology India Limited (KAYNESNS).
- Explore Scenarios: Test various assumptions to assess potential changes in valuation.
- Evaluate and Decide: Use the findings to inform your investment or financial evaluation.
Why Use This Calculator for Kaynes Technology India Limited (KAYNESNS)?
- Designed for Professionals: A sophisticated tool tailored for analysts, CFOs, and consultants in the tech industry.
- Accurate Financial Data: Historical and projected financials for Kaynes Technology preloaded to ensure precision.
- Effective Scenario Analysis: Effortlessly test various forecasts and assumptions to gauge potential outcomes.
- Insightful Results: Automatically computes intrinsic value, NPV, and essential financial metrics.
- User-Friendly Interface: Comprehensive step-by-step guidance to simplify your calculations.
Who Can Benefit from This Product?
- Institutional Investors: Develop comprehensive and trustworthy valuation models for portfolio evaluation.
- Corporate Finance Departments: Examine valuation scenarios to inform strategic decisions.
- Financial Consultants and Advisors: Offer clients precise valuation insights for Kaynes Technology India Limited (KAYNESNS).
- Academic Students and Educators: Utilize real-world data for practice and instruction in financial modeling.
- Technology Enthusiasts: Gain insights into how technology companies like Kaynes Technology India Limited (KAYNESNS) are appraised in the market.
Contents of the Template
- Pre-Filled DCF Model: Kaynes Technology's financial data preloaded for immediate analysis.
- WACC Calculator: Comprehensive calculations for Weighted Average Cost of Capital.
- Financial Ratios: Assess Kaynes Technology's profitability, leverage, and operational efficiency.
- Editable Inputs: Modify assumptions such as growth rates, margins, and CAPEX to suit your specific scenarios.
- Financial Statements: Access annual and quarterly reports for in-depth examination.
- Interactive Dashboard: Visualize key valuation metrics and outcomes with ease.
Disclaimer
All information, articles, and product details provided on this website are for general informational and educational purposes only. We do not claim any ownership over, nor do we intend to infringe upon, any trademarks, copyrights, logos, brand names, or other intellectual property mentioned or depicted on this site. Such intellectual property remains the property of its respective owners, and any references here are made solely for identification or informational purposes, without implying any affiliation, endorsement, or partnership.
We make no representations or warranties, express or implied, regarding the accuracy, completeness, or suitability of any content or products presented. Nothing on this website should be construed as legal, tax, investment, financial, medical, or other professional advice. In addition, no part of this site—including articles or product references—constitutes a solicitation, recommendation, endorsement, advertisement, or offer to buy or sell any securities, franchises, or other financial instruments, particularly in jurisdictions where such activity would be unlawful.
All content is of a general nature and may not address the specific circumstances of any individual or entity. It is not a substitute for professional advice or services. Any actions you take based on the information provided here are strictly at your own risk. You accept full responsibility for any decisions or outcomes arising from your use of this website and agree to release us from any liability in connection with your use of, or reliance upon, the content or products found herein.