
|
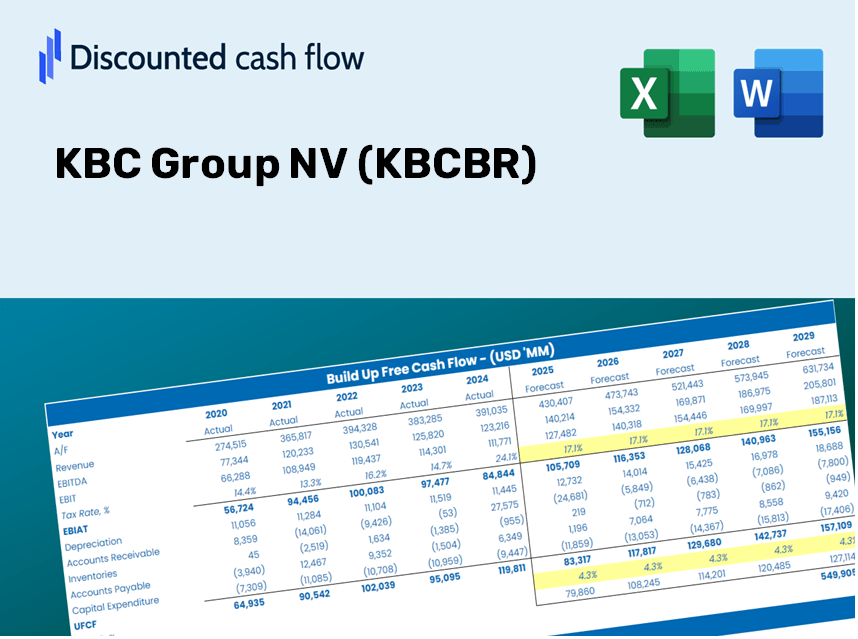
KBC Group NV (KBC.BR) Valation DCF |
Entièrement Modifiable: Adapté À Vos Besoins Dans Excel Ou Sheets
Conception Professionnelle: Modèles Fiables Et Conformes Aux Normes Du Secteur
Pré-Construits Pour Une Utilisation Rapide Et Efficace
Compatible MAC/PC, entièrement débloqué
Aucune Expertise N'Est Requise; Facile À Suivre
KBC Group NV (KBC.BR) Bundle
Simplifiez l'évaluation du groupe KBC Group NV (KBCBR) avec cette calculatrice DCF personnalisable! Doté de la vraie valeur financière du groupe KBC Group NV (KBCBR) et des prévisions réglables, vous pouvez tester les scénarios et découvrir la juste valeur de KBC Group NV (KBCBR) en minutes.
What You Will Receive
- Genuine KBC Data: Preloaded financial information – encompassing revenue to EBIT – derived from actual and projected metrics.
- Comprehensive Customization: Modify all essential parameters (yellow cells) such as WACC, growth %, and tax rates.
- Immediate Valuation Adjustments: Automatic recalculations to evaluate the effect of changes on KBC Group NV’s fair value.
- Flexible Excel Template: Designed for quick edits, scenario analysis, and thorough projections.
- Efficient and Precise: Avoid the hassle of building models from the ground up while ensuring accuracy and adaptability.
Key Features
- Authentic KBC Financial Data: Gain access to reliable pre-loaded historical figures and future forecasts.
- Adjustable Forecast Parameters: Customize highlighted fields, such as WACC, growth rates, and profit margins.
- Real-Time Calculations: Automatic updates for DCF, Net Present Value (NPV), and cash flow assessments.
- User-Friendly Dashboard: Clear and concise charts and summaries to help you interpret your valuation outcomes.
- Designed for All Users: An intuitive layout tailored for investors, CFOs, and consultants, regardless of experience level.
How It Works
- Step 1: Download the Excel file.
- Step 2: Examine KBC Group NV's (KBCBR) pre-filled financial data and projections.
- Step 3: Adjust key inputs such as revenue growth, WACC, and tax rates (highlighted cells).
- Step 4: Observe the DCF model update in real time as you modify your assumptions.
- Step 5: Evaluate the results and apply them to your investment strategy.
Why Choose This Calculator for KBC Group NV (KBCBR)?
- User-Friendly Interface: Tailored for both novices and seasoned professionals.
- Customizable Parameters: Effortlessly adjust inputs to suit your financial analysis.
- Real-Time Feedback: Instantly observe changes in KBC Group’s valuation as you modify inputs.
- Preconfigured Data: Comes with KBC Group’s actual financial information for quick evaluations.
- Recognized by Experts: Valued by investors and analysts for sound decision-making.
Who Should Use This Product?
- Finance Students: Master valuation methodologies and practice with real-world data.
- Academics: Utilize professional models for teaching or research purposes.
- Investors: Challenge your own assumptions and evaluate valuation results for KBC Group NV (KBCBR) stock.
- Analysts: Enhance your efficiency with a customizable, pre-designed DCF model.
- Small Business Owners: Understand the analysis process of large public companies like KBC Group NV (KBCBR).
Contents of the Template
- Pre-Filled Data: Contains KBC Group NV's historical financials and projections.
- Discounted Cash Flow Model: An editable DCF valuation model with automatic calculations.
- Weighted Average Cost of Capital (WACC): A dedicated sheet for WACC calculations using customized inputs.
- Key Financial Ratios: Evaluate KBC Group NV's profitability, efficiency, and leverage.
- Customizable Inputs: Easily modify revenue growth, profit margins, and tax rates.
- Clear Dashboard: Visualizations and tables that summarize essential valuation outcomes.
Disclaimer
All information, articles, and product details provided on this website are for general informational and educational purposes only. We do not claim any ownership over, nor do we intend to infringe upon, any trademarks, copyrights, logos, brand names, or other intellectual property mentioned or depicted on this site. Such intellectual property remains the property of its respective owners, and any references here are made solely for identification or informational purposes, without implying any affiliation, endorsement, or partnership.
We make no representations or warranties, express or implied, regarding the accuracy, completeness, or suitability of any content or products presented. Nothing on this website should be construed as legal, tax, investment, financial, medical, or other professional advice. In addition, no part of this site—including articles or product references—constitutes a solicitation, recommendation, endorsement, advertisement, or offer to buy or sell any securities, franchises, or other financial instruments, particularly in jurisdictions where such activity would be unlawful.
All content is of a general nature and may not address the specific circumstances of any individual or entity. It is not a substitute for professional advice or services. Any actions you take based on the information provided here are strictly at your own risk. You accept full responsibility for any decisions or outcomes arising from your use of this website and agree to release us from any liability in connection with your use of, or reliance upon, the content or products found herein.