
|
Kingstone Companies, Inc. (KINS) Évaluation DCF |
Entièrement Modifiable: Adapté À Vos Besoins Dans Excel Ou Sheets
Conception Professionnelle: Modèles Fiables Et Conformes Aux Normes Du Secteur
Pré-Construits Pour Une Utilisation Rapide Et Efficace
Compatible MAC/PC, entièrement débloqué
Aucune Expertise N'Est Requise; Facile À Suivre
Kingstone Companies, Inc. (KINS) Bundle
Simplifiez l'évaluation de Kingstone Companies, Inc. (KINS) avec cette calculatrice DCF personnalisable! Doté de Real Kingstone Companies, Inc. (KINS) Financials and Adjustable Forecast Intarts, vous pouvez tester les scénarios et découvrir la juste valeur de Kingstone Companies, Inc. (KINS) en minutes.
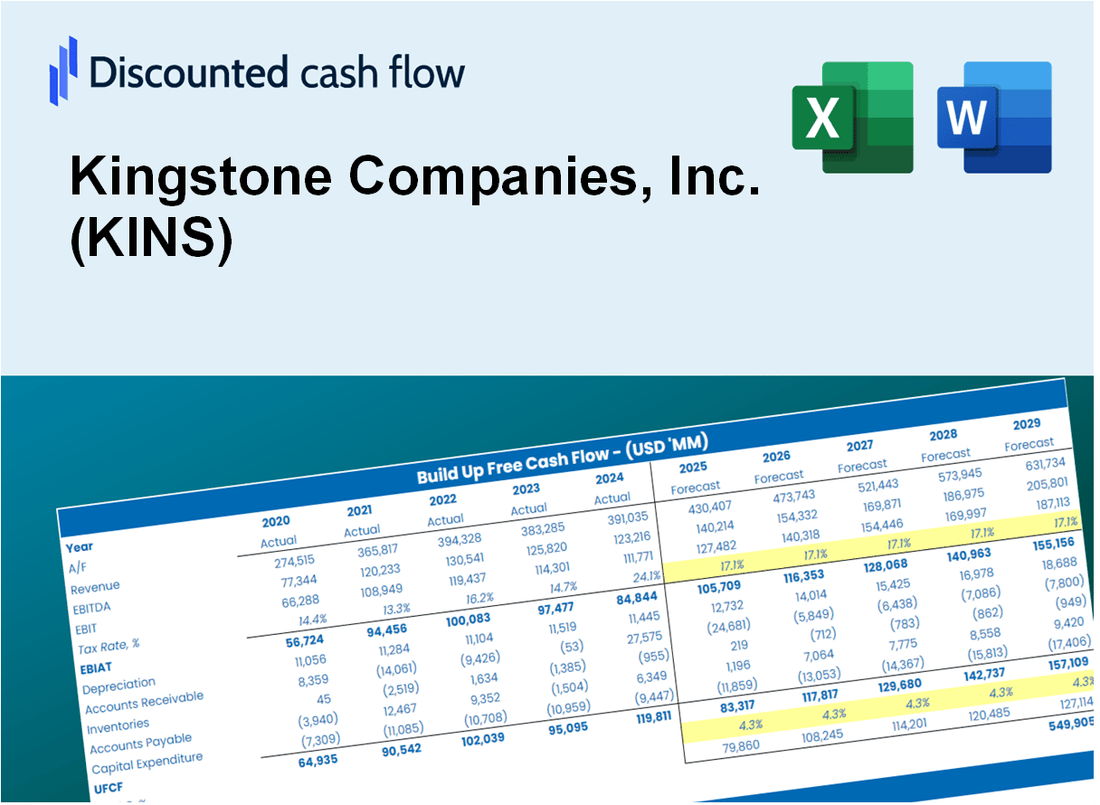
Discounted Cash Flow (DCF) - (USD MM)
| Year | AY1 2020 |
AY2 2021 |
AY3 2022 |
AY4 2023 |
AY5 2024 |
FY1 2025 |
FY2 2026 |
FY3 2027 |
FY4 2028 |
FY5 2029 |
|---|---|---|---|---|---|---|---|---|---|---|
| Revenue | 131.4 | 161.2 | 130.2 | 144.2 | 155.1 | 163.6 | 172.5 | 182.0 | 191.9 | 202.4 |
| Revenue Growth, % | 0 | 22.73 | -19.27 | 10.78 | 7.6 | 5.46 | 5.46 | 5.46 | 5.46 | 5.46 |
| EBITDA | 1.6 | -4.3 | -22.6 | -.4 | 29.3 | -.1 | -.1 | -.1 | -.1 | -.1 |
| EBITDA, % | 1.2 | -2.66 | -17.38 | -0.27017 | 18.85 | -0.05183288 | -0.05183288 | -0.05183288 | -0.05183288 | -0.05183288 |
| Depreciation | 2.9 | 3.3 | 3.3 | 3.0 | 2.4 | 3.4 | 3.6 | 3.8 | 4.0 | 4.2 |
| Depreciation, % | 2.18 | 2.04 | 2.54 | 2.06 | 1.58 | 2.08 | 2.08 | 2.08 | 2.08 | 2.08 |
| EBIT | -1.3 | -7.6 | -25.9 | -3.4 | 26.8 | -3.5 | -3.7 | -3.9 | -4.1 | -4.3 |
| EBIT, % | -0.98029 | -4.7 | -19.92 | -2.33 | 17.28 | -2.13 | -2.13 | -2.13 | -2.13 | -2.13 |
| Total Cash | 177.0 | 182.4 | 166.7 | 9.0 | 28.7 | 106.3 | 112.1 | 118.2 | 124.6 | 131.4 |
| Total Cash, percent | .0 | .0 | .0 | .0 | .0 | .0 | .0 | .0 | .0 | .0 |
| Account Receivables | 57.3 | 52.6 | 80.3 | 89.2 | 91.1 | 84.6 | 89.2 | 94.1 | 99.2 | 104.6 |
| Account Receivables, % | 43.6 | 32.63 | 61.73 | 61.86 | 58.71 | 51.71 | 51.71 | 51.71 | 51.71 | 51.71 |
| Inventories | .0 | .0 | .0 | .0 | .0 | .0 | .0 | .0 | .0 | .0 |
| Inventories, % | 0 | 0 | 0 | 0 | 0 | 0 | 0 | 0 | 0 | 0 |
| Accounts Payable | 7.0 | 13.0 | 13.1 | 12.8 | 10.5 | 12.8 | 13.5 | 14.2 | 15.0 | 15.8 |
| Accounts Payable, % | 5.31 | 8.04 | 10.04 | 8.9 | 6.77 | 7.81 | 7.81 | 7.81 | 7.81 | 7.81 |
| Capital Expenditure | -3.3 | -4.5 | -4.6 | -1.8 | -2.3 | -3.8 | -4.0 | -4.2 | -4.4 | -4.7 |
| Capital Expenditure, % | -2.53 | -2.79 | -3.5 | -1.27 | -1.51 | -2.32 | -2.32 | -2.32 | -2.32 | -2.32 |
| Tax Rate, % | 21.17 | 21.17 | 21.17 | 21.17 | 21.17 | 21.17 | 21.17 | 21.17 | 21.17 | 21.17 |
| EBITAT | 1.0 | -5.9 | -20.9 | -2.8 | 21.1 | -2.2 | -2.4 | -2.5 | -2.6 | -2.8 |
| Depreciation | ||||||||||
| Changes in Account Receivables | ||||||||||
| Changes in Inventories | ||||||||||
| Changes in Accounts Payable | ||||||||||
| Capital Expenditure | ||||||||||
| UFCF | -49.8 | 3.5 | -49.8 | -10.7 | 17.0 | 6.1 | -6.7 | -7.1 | -7.4 | -7.9 |
| WACC, % | 5.43 | 6.88 | 6.92 | 6.98 | 6.89 | 6.62 | 6.62 | 6.62 | 6.62 | 6.62 |
| PV UFCF | ||||||||||
| SUM PV UFCF | -17.4 | |||||||||
| Long Term Growth Rate, % | 2.00 | |||||||||
| Free cash flow (T + 1) | -8 | |||||||||
| Terminal Value | -173 | |||||||||
| Present Terminal Value | -126 | |||||||||
| Enterprise Value | -143 | |||||||||
| Net Debt | -17 | |||||||||
| Equity Value | -126 | |||||||||
| Diluted Shares Outstanding, MM | 12 | |||||||||
| Equity Value Per Share | -10.12 |
What You Will Get
- Real KINS Financial Data: Pre-filled with Kingstone Companies, Inc.’s historical and projected data for precise analysis.
- Fully Editable Template: Modify key inputs like revenue growth, WACC, and EBITDA % with ease.
- Automatic Calculations: See Kingstone Companies, Inc.’s intrinsic value update instantly based on your changes.
- Professional Valuation Tool: Designed for investors, analysts, and consultants seeking accurate DCF results.
- User-Friendly Design: Simple structure and clear instructions for all experience levels.
Key Features
- Comprehensive Financial Data: Gain access to precise pre-loaded historical figures and future estimates for Kingstone Companies, Inc. (KINS).
- Tailorable Forecast Inputs: Modify the highlighted cells, including WACC, growth rates, and profit margins, to suit your analysis.
- Real-Time Calculations: Experience automatic updates for DCF, Net Present Value (NPV), and cash flow evaluations.
- Interactive Dashboard: Utilize straightforward charts and summaries to clearly present your valuation findings.
- Designed for All Skill Levels: An accessible and user-friendly layout intended for investors, CFOs, and consultants alike.
How It Works
- Download: Obtain the comprehensive Excel file containing Kingstone Companies, Inc.'s (KINS) financial data.
- Customize: Tailor your forecasts, including revenue growth, EBITDA %, and WACC to fit your analysis.
- Update Automatically: The intrinsic value and NPV calculations refresh in real-time as you make changes.
- Test Scenarios: Generate various projections and instantly compare the results.
- Make Decisions: Leverage the valuation insights to inform your investment decisions.
Why Choose Kingstone Companies, Inc. (KINS)?
- Streamlined Process: Skip the hassle of building complex models – our tools are ready for immediate use.
- Enhanced Precision: Access to accurate financial data and methodologies minimizes valuation errors.
- Completely Adaptable: Modify the model to suit your unique assumptions and forecasts.
- User-Friendly: Intuitive charts and results facilitate straightforward analysis.
- Endorsed by Professionals: Crafted for industry experts who prioritize accuracy and functionality.
Who Should Use Kingstone Companies, Inc. (KINS)?
- Insurance Students: Discover underwriting principles and apply them using real-world case studies.
- Researchers: Integrate industry-standard models into academic projects or publications.
- Investors: Evaluate your investment strategies and assess the performance metrics of Kingstone Companies, Inc. (KINS).
- Financial Analysts: Enhance your analysis process with a tailored, comprehensive financial model.
- Small Business Owners: Understand how publicly traded insurance companies like Kingstone are evaluated in the market.
What the Template Contains
- Operating and Balance Sheet Data: Pre-filled Kingstone Companies, Inc. (KINS) historical data and forecasts, including revenue, EBITDA, EBIT, and capital expenditures.
- WACC Calculation: A dedicated sheet for Weighted Average Cost of Capital (WACC), including parameters like Beta, risk-free rate, and share price.
- DCF Valuation (Unlevered and Levered): Editable Discounted Cash Flow models showing intrinsic value with detailed calculations.
- Financial Statements: Pre-loaded financial statements (annual and quarterly) to support analysis.
- Key Ratios: Includes profitability, leverage, and efficiency ratios for Kingstone Companies, Inc. (KINS).
- Dashboard and Charts: Visual summary of valuation outputs and assumptions to analyze results easily.
Disclaimer
All information, articles, and product details provided on this website are for general informational and educational purposes only. We do not claim any ownership over, nor do we intend to infringe upon, any trademarks, copyrights, logos, brand names, or other intellectual property mentioned or depicted on this site. Such intellectual property remains the property of its respective owners, and any references here are made solely for identification or informational purposes, without implying any affiliation, endorsement, or partnership.
We make no representations or warranties, express or implied, regarding the accuracy, completeness, or suitability of any content or products presented. Nothing on this website should be construed as legal, tax, investment, financial, medical, or other professional advice. In addition, no part of this site—including articles or product references—constitutes a solicitation, recommendation, endorsement, advertisement, or offer to buy or sell any securities, franchises, or other financial instruments, particularly in jurisdictions where such activity would be unlawful.
All content is of a general nature and may not address the specific circumstances of any individual or entity. It is not a substitute for professional advice or services. Any actions you take based on the information provided here are strictly at your own risk. You accept full responsibility for any decisions or outcomes arising from your use of this website and agree to release us from any liability in connection with your use of, or reliance upon, the content or products found herein.