
|
Kennametal Inc. (KMT): 5 Analyse des forces [Jan-2025 Mis à jour] |
Entièrement Modifiable: Adapté À Vos Besoins Dans Excel Ou Sheets
Conception Professionnelle: Modèles Fiables Et Conformes Aux Normes Du Secteur
Pré-Construits Pour Une Utilisation Rapide Et Efficace
Compatible MAC/PC, entièrement débloqué
Aucune Expertise N'Est Requise; Facile À Suivre
Kennametal Inc. (KMT) Bundle
Dans le monde à enjeux élevés des outils de travail des métaux de précision, Kennametal Inc. (KMT) navigue dans un paysage concurrentiel complexe où l'innovation technologique, les relations stratégiques des fournisseurs et la dynamique du marché convergent. À mesure que la fabrication mondiale évolue, la compréhension des forces complexes façonnant les activités de Kennametal devient cruciale - des chaînes d'approvisionnement en matières premières spécialisées à l'intense rivalité technologique parmi les fabricants mondiaux. Cette plongée profonde dans les cinq forces de Porter révèle les défis stratégiques et les opportunités qui définissent le positionnement concurrentiel de Kennametal en 2024, offrant un aperçu de la façon dont l'entreprise maintient son avantage dans un écosystème industriel de plus en plus sophistiqué.
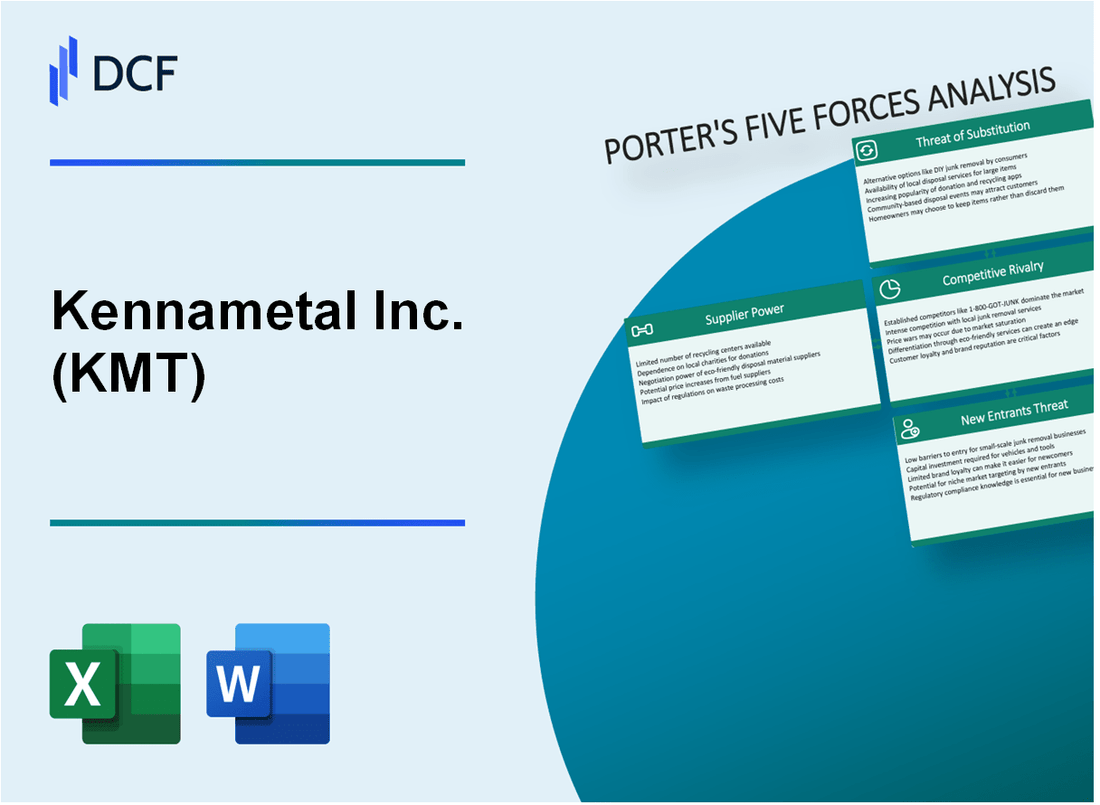
Kennametal Inc. (KMT) - Porter's Five Forces: Bargaining Power des fournisseurs
Nombre limité de fournisseurs de matières premières spécialisés
En 2024, Kennametal fait face à un marché de fournisseurs concentrés pour les matériaux critiques de l'outil de travail des métaux. Les fournisseurs de carbure de tungstène sont estimés à moins de 10 fabricants mondiaux, avec les meilleurs fournisseurs, notamment:
| Fournisseur | Part de marché mondial | Capacité de production |
|---|---|---|
| Sandvik AB | 28.5% | 45 000 tonnes métriques / an |
| Groupe de Ceratizit | 22.7% | 35 000 tonnes métriques / an |
| Les fournisseurs directs de Kennametal | 15.3% | 24 000 tonnes métriques / an |
Coûts de commutation élevés pour les matériaux avancés
Les coûts de commutation des fournisseurs pour les matériaux avancés sont importants:
- Processus de qualification en carbure de tungstène: 750 000 $ - 1,2 million de dollars
- Test de matériel et certification: temps de développement de 6 à 9 mois
- Qualification d'entrée en métaux rares: jusqu'à 2,3 millions de dollars d'investissement
Concentration des fournisseurs dans les matériaux de l'outil de coupe
Le marché avancé des matériaux d'outils de coupe démontre une concentration élevée:
- Les 4 meilleurs fournisseurs contrôlent 72,6% du marché mondial
- Marché restant fragmenté chez 15 à 20 petits fabricants
- Valeur marchande mondiale annuelle: 18,4 milliards de dollars en 2024
Investissement dans les relations avec les fournisseurs
Le développement des relations avec les fournisseurs de Kennametal nécessite des ressources substantielles:
| Catégorie d'investissement | Dépenses annuelles |
|---|---|
| Qualification des fournisseurs | 3,6 millions de dollars |
| Collaboration technique | 2,1 millions de dollars |
| Intégration de la chaîne d'approvisionnement | 4,2 millions de dollars |
Kennametal Inc. (KMT) - Porter's Five Forces: Bargaining Power of Clients
Composition de la clientèle
Kennametal sert les clients dans plusieurs secteurs avec la ventilation suivante:
| Secteur | Pourcentage de clientèle |
|---|---|
| Fabrication | 42% |
| Aérospatial | 23% |
| Automobile | 35% |
Power d'achat des clients
Les principaux clients industriels représentent une influence importante du marché:
- Les 10 meilleurs clients représentent 37% du total des revenus
- Valeur du contrat moyen: 2,4 millions de dollars
- Durée du contrat: 3-5 ans
Analyse de la sensibilité aux prix
| Facteur d'élasticité des prix | Pourcentage d'impact |
|---|---|
| Indice de sensibilité aux prix | 0.65 |
| Effort de levier de négociation des prix du client | 48% |
Demande de personnalisation
Demandes de solution d'ingénierie:
- Demandes d'outillage personnalisées: 62 par trimestre
- Temps de développement moyen par solution personnalisée: 6-8 semaines
- Prix de solution personnalisée Premium: 22-28%
Métriques relationnelles à long terme
| Métrique relationnelle | Valeur |
|---|---|
| Taux de rétention de clientèle moyen | 84% |
| Répéter le pourcentage d'entreprise | 76% |
| Durée moyenne des relations avec le client | 7,3 ans |
Kennametal Inc. (KMT) - Five Forces de Porter: Rivalité compétitive
Tableaux d'outils de travail métallique mondiaux Paysage concurrentiel
En 2024, Kennametal Inc. fait face à une concurrence intense dans l'industrie des outils de travail des métaux avec les principaux concurrents suivants:
| Concurrent | Part de marché | Revenus annuels |
|---|---|---|
| Sandvik AB | 18.5% | 10,4 milliards de dollars |
| ISCAR Metalworking | 15.3% | 6,2 milliards de dollars |
| OSG Corporation | 12.7% | 4,8 milliards de dollars |
| Kennametal Inc. | 10.2% | 2,1 milliards de dollars |
Investissement de la recherche et du développement
Les dépenses de R&D de Kennametal en 2023 étaient 147,3 millions de dollars, représentant 7.1% de ses revenus annuels totaux.
Métriques d'innovation technologique
- Nombre de brevets déposés en 2023: 42
- Cycles de développement de nouveaux produits: 18-24 mois
- Taille moyenne de l'équipe de R&D: 276 ingénieurs
Pression des coûts de fabrication
Objectifs de réduction des coûts de fabrication pour 2024:
| Zone de réduction des coûts | Pourcentage ciblé |
|---|---|
| Source des matériaux | 5.3% |
| Efficacité de production | 4.7% |
| Frais généraux opérationnels | 3.9% |
Indicateurs de performance compétitifs
Mesures de performance clés pour Kennametal en 2023:
- Marge brute: 36,5%
- Marge opérationnelle: 9,2%
- Capitalisation boursière: 2,3 milliards de dollars
- Installations de fabrication mondiale: 16 emplacements
Kennametal Inc. (KMT) - Five Forces de Porter: menace de substituts
Outils de coupe en céramique et diamant avancés
Le marché mondial des outils de coupe en céramique avancée était de 4,2 milliards de dollars en 2022, avec un TCAC projeté de 6,7% à 2027. Le marché des outils de coupe enrobés de diamants a atteint 1,8 milliard de dollars en 2023, démontrant un potentiel concurrentiel important contre les outils traditionnels en carbure de tungstène.
| Type d'outil | Taille du marché 2023 | Taux de croissance |
|---|---|---|
| Outils en céramique avancés | 4,2 milliards de dollars | 6,7% CAGR |
| Outils enrobés de diamant | 1,8 milliard de dollars | 5,2% CAGR |
Technologies de fabrication alternatives
Marché de la fabrication d'impression 3D d'une valeur de 17,4 milliards de dollars en 2023, avec une fabrication additive qui devrait atteindre 44,5 milliards de dollars d'ici 2027.
- Taux de croissance du marché mondial de l'impression 3D: 21,5% par an
- Secteurs aérospatiaux et automobiles conduisant une alternative à l'adoption de la fabrication
- Potentiel de réduction des coûts estimés: 30 à 50% par rapport à l'usinage traditionnel
Solutions d'usinage hybride
Le marché des technologies de fabrication hybride devrait atteindre 3,6 milliards de dollars d'ici 2025, avec un taux de croissance annuel composé de 14,2%.
| Technologie | 2023 Valeur marchande | 2025 Valeur projetée |
|---|---|---|
| Usinage hybride | 2,1 milliards de dollars | 3,6 milliards de dollars |
Techniques de fabrication numérique
La taille du marché de la fabrication numérique a atteint 360,2 milliards de dollars en 2023, avec une croissance attendue à 870,5 milliards de dollars d'ici 2028.
- Taux d'adoption de la fabrication numérique dans la fabrication: 42%
- Réduction potentielle de la demande d'outils: 25 à 35% grâce aux techniques numériques
- Augmentation estimée de la productivité: 15-20%
Kennametal Inc. (KMT) - Five Forces de Porter: menace de nouveaux entrants
Exigences de capital élevé pour les installations de fabrication avancées
Les installations de fabrication avancées de Kennametal nécessitent des investissements en capital importants. En 2023, la propriété, l'usine et l'équipement de la société (PP&E) s'élevaient à 1,06 milliard de dollars. Les coûts de configuration initiaux pour les installations de fabrication d'outils de précision peuvent varier entre 50 et 150 millions de dollars.
| Catégorie d'investissement | Plage de coûts estimés |
|---|---|
| Configuration des installations de fabrication | 50 M $ - 150 M $ |
| Machinerie avancée | 20 M $ - 75 M $ |
| Infrastructure technologique initiale | 10 M $ - 30 M $ |
Propriété intellectuelle et barrières de brevets
Kennametal tient 237 brevets actifs En 2023, créant des obstacles à l'entrée substantielles pour les concurrents potentiels.
- Valeur du portefeuille de brevets estimé à 42 millions de dollars
- Investissement annuel de R&D de 78,4 millions de dollars
- Protection des brevets Durée: 15-20 ans
Exigences d'expertise technologique
La fabrication d'outils de précision exige des capacités technologiques complexes. La main-d'œuvre d'ingénierie de Kennametal comprend 1 247 ingénieurs spécialisés titulaires d'un diplôme avancé.
| Expertise en génie | Nombre de professionnels |
|---|---|
| Ingénieurs de niveau doctoral | 187 |
| Ingénieurs de niveau maître | 542 |
| Ingénieurs de niveau baccalauréat | 518 |
Réputation de la marque établie
La présence sur le marché de Kennametal s'étend sur 60 pays, avec un score de reconnaissance de marque de 84/100 dans les segments de fabrication industrielle.
Investissements de recherche et développement
Les investissements en R&D démontrent des défis d'entrée sur le marché importants. En 2023, Kennametal a alloué 78,4 millions de dollars à la recherche et au développement, ce qui représente 4,2% des revenus totaux.
| Métrique d'investissement de R&D | Valeur 2023 |
|---|---|
| Dépenses totales de R&D | 78,4 millions de dollars |
| Pourcentage de revenus | 4.2% |
| Cycles de développement de nouveaux produits | 18-24 mois |
Kennametal Inc. (KMT) - Porter's Five Forces: Competitive rivalry
You're looking at the competitive intensity in the industrial technology space, and honestly, it's a tough neighborhood. The industry where Kennametal Inc. operates-producing tooling, metal cutting products, and wear-resistant solutions-is characterized as a large, fragmented market that is highly competitive. This means that while Kennametal Inc. is a major player, it faces a swarm of rivals, including many smaller niche businesses offering specialized capabilities globally.
Kennametal Inc.'s scale, with reported sales of $1,967 million for fiscal year 2025, is significant, but it competes directly against firms both larger and smaller. The rivalry isn't just about who can offer the lowest sticker price; competition centers heavily on the tangible value delivered through product performance, material quality, and the pace of R&D innovation. You have to keep delivering superior uptime and precision to maintain share.
To map out the competitive field, consider the scale of some of the other large industrial technology firms that play in similar arenas. Here's a quick look at how Kennametal Inc.'s $1.97 billion (rounded FY25 revenue) stacks up against a few publicly noted peers:
| Company | Reported Revenue (Latest Available) | Entity Type |
|---|---|---|
| Kennametal Inc. (KMT) | $1,967 million (FY25 Sales) | Public |
| Curtiss-Wright Corp | $3.1B | Public |
| Nordson Corp | $2.7B | Public |
| Alamo Group Inc | $1.6B | Public |
The competitive dynamic is further sharpened by Kennametal Inc.'s aggressive internal restructuring. The company is actively consolidating its global footprint to drive down structural costs, which naturally intensifies the cost-based elements of the rivalry. Kennametal Inc. has already achieved $65 million in annualized run-rate pre-tax savings since fiscal year 2024. The firm is targeting a total of $125 million in run-rate pre-tax savings by June 2027, exceeding its initial $100 million Investor Day goal. This focus on operational excellence means rivals must respond with their own efficiency drives.
The actions taken by Kennametal Inc. to streamline operations-such as completing the divestiture of its Goshen, IN subsidiary, closing the Greenfield, MA facility, and consolidating operations in Barcelona, Spain-are direct responses to competitive pressures and market softness. These moves aim to ease structural margin pressures and provide flexibility, but they also signal to competitors that Kennametal Inc. is serious about cost discipline.
The key competitive vectors you should watch include:
- Focus on Aerospace & Defense wins.
- New application wins in Energy, like power generation for AI data centers.
- Protecting margins against tariff impacts and foreign exchange weakness.
- Continuous investment in materials science and tooling innovation.
If onboarding takes 14+ days, churn risk rises.
Finance: draft 13-week cash view by Friday.
Kennametal Inc. (KMT) - Porter's Five Forces: Threat of substitutes
You're looking at the competitive landscape for Kennametal Inc. (KMT) as of late 2025, and the threat of substitutes is definitely a persistent concern. It's not just about a competitor selling a slightly better carbide insert; it's about entirely different ways of making things.
Advanced materials like ceramics and industrial diamonds pose a long-term threat to cemented carbide tools. Honestly, these materials offer superior hardness and heat resistance in certain niche, high-demand applications, potentially eroding market share where Kennametal Inc. has traditionally dominated. To fight this, Kennametal Inc. is leaning hard on its innovation pipeline. For fiscal 2025, the company launched more than 20 new innovative products commercially. Plus, they maintain a strong intellectual property base, holding over 1,800 active patents worldwide as of their FY2025 report. That's the moat they are building against material science breakthroughs from others.
Digital manufacturing and AI-powered CAM software (computer-aided manufacturing) are emerging process substitutes. This isn't about replacing the physical tool yet, but about optimizing its use so efficiently that customers need fewer tools or can switch to less material-intensive processes. To be fair, Kennametal Inc. is actively engaging this trend. They are securing key wins in areas like the expansion of AI digital infrastructure, leveraging advanced indexable inserts and precision machining technologies to support that growth. This shows they are adapting the application of their products to the new digital reality, rather than just waiting for the process to replace them.
High-performance tooling substitutes require significant capital investment and re-tooling by customers. If a customer has to spend millions on new machines and training to switch to a ceramic-based process, that acts as a switching cost, which helps Kennametal Inc. in the near term. However, the pressure remains to offer solutions that integrate easily or provide such a massive productivity leap that the capital outlay is justified. Kennametal Inc. invested $89 million in capital expenditures in fiscal 2025, which supports their own manufacturing base and process improvements, but it's a different kind of investment than what a customer faces when switching suppliers.
Here's a quick look at how Kennametal Inc.'s investment in innovation stacks up against their overall financial scale for fiscal 2025:
| Metric | Value (FY2025) |
|---|---|
| Total Sales | $1.97 billion |
| Capital Expenditures | $89 million |
| Active Patents Worldwide | Over 1,800 |
| New Products Launched Commercially | More than 20 |
| Free Operating Cash Flow | $121 million |
The focus on new product development is a direct response to the substitution threat. They aren't just selling the same thing; they are trying to stay ahead of the curve. If onboarding takes 14+ days, churn risk rises, and that applies to new product adoption too.
Finance: draft 13-week cash view by Friday.
Kennametal Inc. (KMT) - Porter's Five Forces: Threat of new entrants
You're looking at the barriers Kennametal Inc. faces from potential new competitors trying to break into the industrial technology space. Honestly, the hurdles here are substantial, built up over decades of specialized investment and market presence.
High capital requirements for state-of-the-art manufacturing facilities and global distribution are a strong barrier. Setting up the necessary infrastructure to compete on quality and scale demands serious upfront cash. For context, Kennametal Inc. reported capital spending of approximately $90 million in fiscal year 2025, which gives you a rough idea of the ongoing investment required just to maintain and modernize existing operations. Furthermore, a new entrant would need to match the liquidity to sustain operations while building scale; Kennametal Inc. ended its fiscal year 2025 with cash and cash equivalents of $140.5 million. That level of initial outlay and working capital support is a major deterrent.
New entrants face difficulty securing reliable, high-quality supply of specialized raw materials like tungsten and cobalt. These materials are the backbone of cemented carbide products, and the supply chain is geographically concentrated and volatile. China, for instance, accounted for approximately 85% of global tungsten ore production in 2024. Kennametal Inc. itself reported a high dependence on Chinese tungsten raw materials at 40%. A new player would immediately face this sourcing bottleneck, which is complicated by geopolitical factors and tariffs. To be fair, Kennametal Inc.'s internal recycling capability helps mitigate this, as recycling costs are about 30% less than virgin ore. A new entrant would need to rapidly develop or secure equivalent, stable sourcing agreements.
Established brands and long-standing customer relationships in key sectors like aerospace create high entry barriers. These relationships are built on trust, proven performance, and often, complex qualification processes. Consider the end markets Kennametal Inc. serves; in fiscal year 2025, the Aerospace & Defense segment represented 13% of its sales. Breaking into these highly regulated and performance-critical supply chains requires years of validation, something a startup simply cannot replicate quickly. These established ties mean customers are reluctant to switch suppliers unless there is a compelling, proven advantage.
Intellectual property protection on materials science and tooling designs deters new competition. Protecting proprietary knowledge is key to maintaining a competitive edge in this technology-driven field. Kennametal Inc. invested $44.4 million in Research and Development costs during fiscal year 2025, signaling a continuous commitment to innovation that results in patents and trade secrets. This investment creates a moat of protected technology that new entrants would have to spend heavily to replicate or legally navigate around.
Here's a quick look at some of the financial scale involved in this industry:
| Metric (FY2025 Data) | Amount | Context |
|---|---|---|
| Capital Spending | $90 million | Required investment for maintenance and modernization |
| Free Operating Cash Flow (FOCF) | $121 million | Cash generation available for investment/operations |
| R&D Costs Expensed | $44.4 million | Investment in proprietary technology and IP |
| Aerospace & Defense Sales Share | 13% | Example of a key, relationship-driven end market |
The barriers are high, but not insurmountable if a new entrant has disruptive technology or massive funding. Still, the capital intensity and raw material dependence definitely keep the threat of new entrants moderate to low for now.
Disclaimer
All information, articles, and product details provided on this website are for general informational and educational purposes only. We do not claim any ownership over, nor do we intend to infringe upon, any trademarks, copyrights, logos, brand names, or other intellectual property mentioned or depicted on this site. Such intellectual property remains the property of its respective owners, and any references here are made solely for identification or informational purposes, without implying any affiliation, endorsement, or partnership.
We make no representations or warranties, express or implied, regarding the accuracy, completeness, or suitability of any content or products presented. Nothing on this website should be construed as legal, tax, investment, financial, medical, or other professional advice. In addition, no part of this site—including articles or product references—constitutes a solicitation, recommendation, endorsement, advertisement, or offer to buy or sell any securities, franchises, or other financial instruments, particularly in jurisdictions where such activity would be unlawful.
All content is of a general nature and may not address the specific circumstances of any individual or entity. It is not a substitute for professional advice or services. Any actions you take based on the information provided here are strictly at your own risk. You accept full responsibility for any decisions or outcomes arising from your use of this website and agree to release us from any liability in connection with your use of, or reliance upon, the content or products found herein.