
|
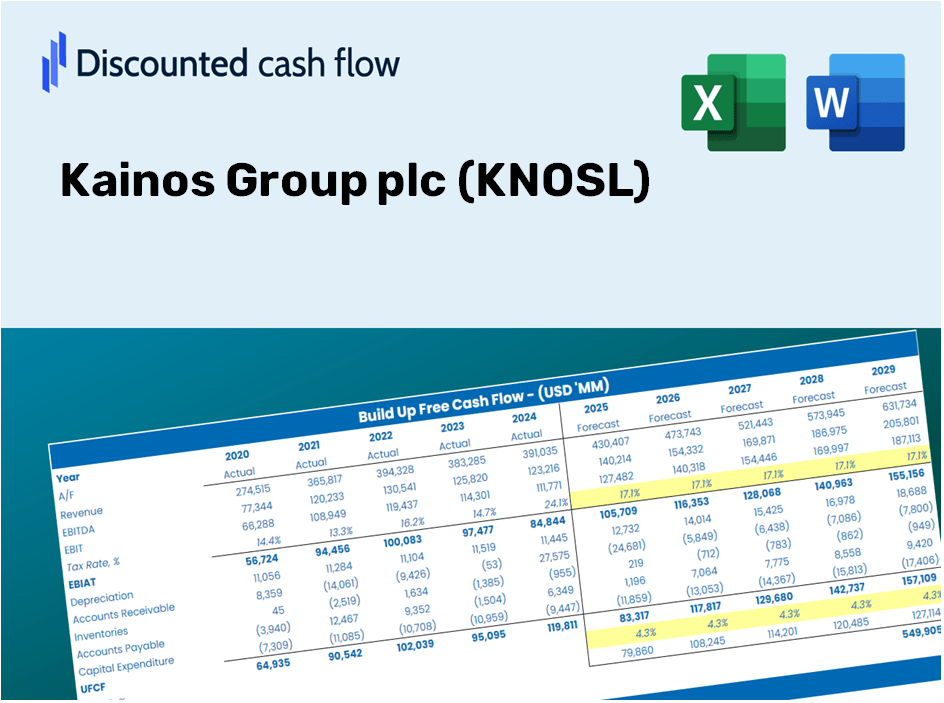
Kainos Group Plc (KNOS.L) Évaluation DCF |
Entièrement Modifiable: Adapté À Vos Besoins Dans Excel Ou Sheets
Conception Professionnelle: Modèles Fiables Et Conformes Aux Normes Du Secteur
Pré-Construits Pour Une Utilisation Rapide Et Efficace
Compatible MAC/PC, entièrement débloqué
Aucune Expertise N'Est Requise; Facile À Suivre
Kainos Group plc (KNOS.L) Bundle
Évaluez les perspectives financières de Kainos Group PLC comme un professionnel! Cette calculatrice DCF (KNOSL) fournit des données financières pré-remplies et offre la flexibilité de modifier la croissance des revenus, le WACC, les marges bénéficiaires et d'autres hypothèses essentielles pour s'aligner sur vos prévisions.
What You Will Receive
- Comprehensive KNOSL Financials: Access to both historical and projected data for precise valuation.
- Customizable Parameters: Adjust WACC, tax rates, revenue growth, and capital expenditures as needed.
- Real-Time Calculations: Dynamic computation of intrinsic value and NPV.
- Scenario Simulation: Explore various scenarios to assess Kainos Group's future performance.
- User-Friendly Interface: Designed for professionals but easy for beginners to navigate.
Key Features
- Comprehensive Kainos Financial Data: Pre-loaded with Kainos Group plc’s [KNOSL] historical financial information and future forecasts.
- Customizable Assumptions: Fine-tune revenue growth, profit margins, discount rates, tax considerations, and capital investments.
- Interactive Valuation Model: Automatic recalculations of Net Present Value (NPV) and intrinsic value in response to your modifications.
- Scenario Analysis: Develop and evaluate various predictive scenarios to explore a range of valuation possibilities.
- Intuitive User Interface: Designed to be straightforward and accessible for both industry professionals and newcomers.
How It Functions
- Download the Template: Gain immediate access to the Excel-based Kainos Group plc (KNOSL) DCF Calculator.
- Input Your Assumptions: Modify the yellow-highlighted cells for growth rates, WACC, margins, and other variables.
- Instant Calculations: The model automatically recalculates Kainos Group's intrinsic value.
- Test Scenarios: Experiment with different assumptions to assess potential changes in valuation.
- Analyze and Decide: Utilize the results to inform your investment or financial strategies.
Why Opt for This Calculator?
- Reliable Data: Actual Kainos Group plc (KNOSL) financials provide trustworthy valuation outcomes.
- Customizable: Modify essential parameters such as growth rates, WACC, and tax rates to align with your forecasts.
- Time-Efficient: Built-in calculations save you the hassle of starting from the beginning.
- Professional-Quality Tool: Tailored for investors, analysts, and consultants.
- User-Friendly: An intuitive design and clear instructions ensure accessibility for all users.
Who Can Benefit from Using Kainos Group plc (KNOSL)?
- Finance Students: Discover valuation methodologies and apply them with actual market data.
- Researchers and Academics: Integrate industry-standard models into your lectures and scholarly work.
- Investors: Validate your investment hypotheses and conduct in-depth valuation analyses on Kainos Group plc (KNOSL).
- Financial Analysts: Enhance your analysis process with a pre-designed, flexible DCF model.
- Entrepreneurs and Small Business Owners: Understand the valuation approaches used for analyzing large publicly traded companies like Kainos Group plc (KNOSL).
Contents of the Template
- Comprehensive DCF Model: Editable template featuring detailed valuation calculations.
- Real-World Data: Kainos Group plc’s (KNOSL) historical and projected financials preloaded for thorough analysis.
- Customizable Parameters: Modify WACC, growth rates, and tax assumptions to explore various scenarios.
- Financial Statements: Complete annual and quarterly breakdowns for enhanced insights.
- Key Ratios: Integrated analysis for evaluating profitability, efficiency, and leverage.
- Dashboard with Visual Outputs: Charts and tables designed for clear, actionable results.
Disclaimer
All information, articles, and product details provided on this website are for general informational and educational purposes only. We do not claim any ownership over, nor do we intend to infringe upon, any trademarks, copyrights, logos, brand names, or other intellectual property mentioned or depicted on this site. Such intellectual property remains the property of its respective owners, and any references here are made solely for identification or informational purposes, without implying any affiliation, endorsement, or partnership.
We make no representations or warranties, express or implied, regarding the accuracy, completeness, or suitability of any content or products presented. Nothing on this website should be construed as legal, tax, investment, financial, medical, or other professional advice. In addition, no part of this site—including articles or product references—constitutes a solicitation, recommendation, endorsement, advertisement, or offer to buy or sell any securities, franchises, or other financial instruments, particularly in jurisdictions where such activity would be unlawful.
All content is of a general nature and may not address the specific circumstances of any individual or entity. It is not a substitute for professional advice or services. Any actions you take based on the information provided here are strictly at your own risk. You accept full responsibility for any decisions or outcomes arising from your use of this website and agree to release us from any liability in connection with your use of, or reliance upon, the content or products found herein.