
|
KODIAK SCIENCES Inc. (KOD) Évaluation DCF |
Entièrement Modifiable: Adapté À Vos Besoins Dans Excel Ou Sheets
Conception Professionnelle: Modèles Fiables Et Conformes Aux Normes Du Secteur
Pré-Construits Pour Une Utilisation Rapide Et Efficace
Compatible MAC/PC, entièrement débloqué
Aucune Expertise N'Est Requise; Facile À Suivre
Kodiak Sciences Inc. (KOD) Bundle
Conçu pour la précision, notre (KOD) Calculator DCF vous permet d'évaluer l'évaluation de Kodiak Sciences Inc. à l'aide de données financières réelles, offrant une flexibilité complète pour modifier tous les paramètres clés pour des projections améliorées.
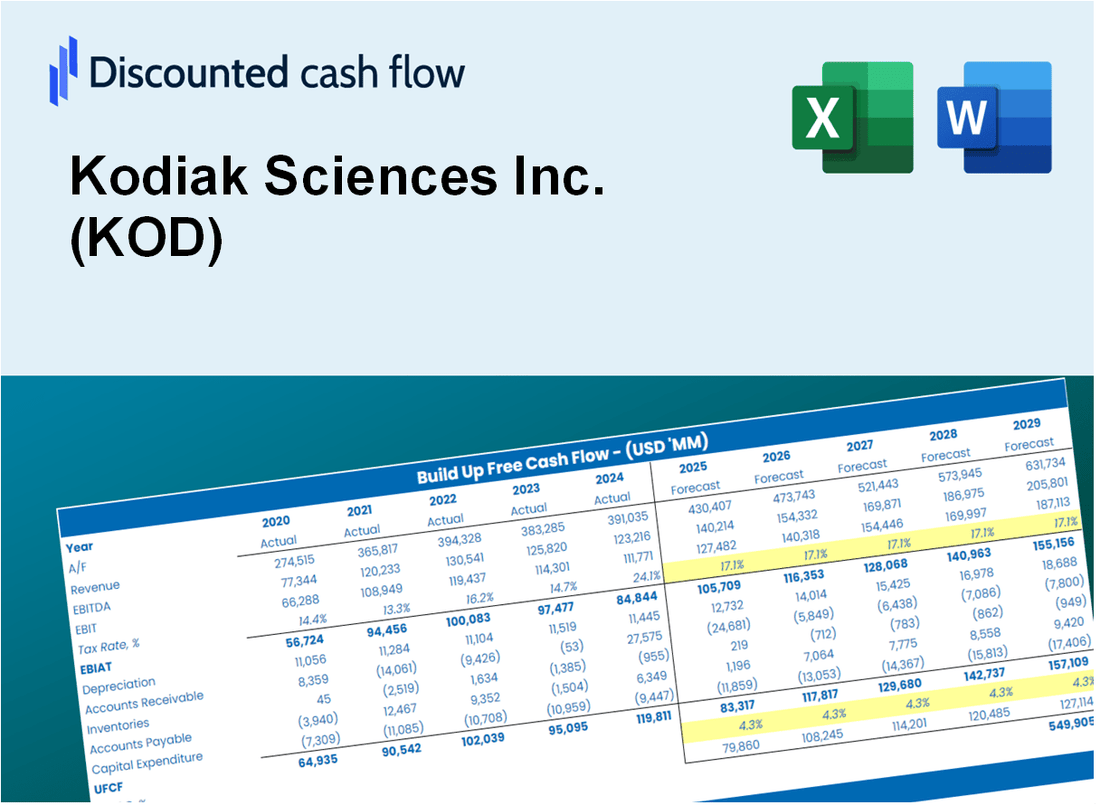
Discounted Cash Flow (DCF) - (USD MM)
| Year | AY1 2020 |
AY2 2021 |
AY3 2022 |
AY4 2023 |
AY5 2024 |
FY1 2025 |
FY2 2026 |
FY3 2027 |
FY4 2028 |
FY5 2029 |
|---|---|---|---|---|---|---|---|---|---|---|
| Revenue | .0 | .0 | .0 | .0 | .0 | .0 | .0 | .0 | .0 | .0 |
| Revenue Growth, % | 0 | 0 | 0 | 0 | 0 | 0 | 0 | 0 | 0 | 0 |
| EBITDA | -128.9 | -258.3 | -322.8 | -234.5 | -149.5 | .0 | .0 | .0 | .0 | .0 |
| EBITDA, % | 100 | 100 | 100 | 100 | 100 | 100 | 100 | 100 | 100 | 100 |
| Depreciation | 4.2 | 8.7 | 11.0 | 25.9 | 26.7 | .0 | .0 | .0 | .0 | .0 |
| Depreciation, % | 100 | 100 | 100 | 100 | 100 | 100 | 100 | 100 | 100 | 100 |
| EBIT | -133.1 | -267.0 | -333.8 | -260.5 | -176.2 | .0 | .0 | .0 | .0 | .0 |
| EBIT, % | 100 | 100 | 100 | 100 | 100 | 100 | 100 | 100 | 100 | 100 |
| Total Cash | 969.0 | 731.5 | 478.9 | 285.5 | 168.1 | .0 | .0 | .0 | .0 | .0 |
| Total Cash, percent | .0 | .0 | .0 | .0 | .0 | .0 | .0 | .0 | .0 | .0 |
| Account Receivables | .0 | .0 | .0 | .0 | .0 | .0 | .0 | .0 | .0 | .0 |
| Account Receivables, % | 100 | 100 | 100 | 100 | 100 | 100 | 100 | 100 | 100 | 100 |
| Inventories | .0 | .0 | .0 | .0 | .0 | .0 | .0 | .0 | .0 | .0 |
| Inventories, % | 100 | 100 | 100 | 100 | 100 | 100 | 100 | 100 | 100 | 100 |
| Accounts Payable | 8.6 | 12.4 | 9.1 | 13.6 | 3.9 | .0 | .0 | .0 | .0 | .0 |
| Accounts Payable, % | 100 | 100 | 100 | 100 | 100 | 100 | 100 | 100 | 100 | 100 |
| Capital Expenditure | -7.0 | -63.3 | -47.4 | -41.4 | -.4 | .0 | .0 | .0 | .0 | .0 |
| Capital Expenditure, % | 100 | 100 | 100 | 100 | 100 | 0 | 0 | 0 | 0 | 0 |
| Tax Rate, % | 0 | 0 | 0 | 0 | 0 | 0 | 0 | 0 | 0 | 0 |
| EBITAT | -133.1 | -267.0 | -333.8 | -260.5 | -176.2 | .0 | .0 | .0 | .0 | .0 |
| Depreciation | ||||||||||
| Changes in Account Receivables | ||||||||||
| Changes in Inventories | ||||||||||
| Changes in Accounts Payable | ||||||||||
| Capital Expenditure | ||||||||||
| UFCF | -127.2 | -317.8 | -373.5 | -271.5 | -159.6 | -3.9 | .0 | .0 | .0 | .0 |
| WACC, % | 15.72 | 15.72 | 15.72 | 15.72 | 15.72 | 15.72 | 15.72 | 15.72 | 15.72 | 15.72 |
| PV UFCF | ||||||||||
| SUM PV UFCF | -3.4 | |||||||||
| Long Term Growth Rate, % | 2.00 | |||||||||
| Free cash flow (T + 1) | 0 | |||||||||
| Terminal Value | 0 | |||||||||
| Present Terminal Value | 0 | |||||||||
| Enterprise Value | -3 | |||||||||
| Net Debt | -98 | |||||||||
| Equity Value | 94 | |||||||||
| Diluted Shares Outstanding, MM | 53 | |||||||||
| Equity Value Per Share | 1.79 |
What You Will Get
- Real Kodiak Data: Preloaded financials – from revenue to EBIT – based on actual and projected figures for Kodiak Sciences Inc. (KOD).
- Full Customization: Adjust all critical parameters (yellow cells) such as WACC, growth %, and tax rates to fit your analysis.
- Instant Valuation Updates: Automatic recalculations to assess the impact of changes on Kodiak's fair value.
- Versatile Excel Template: Designed for quick edits, scenario testing, and comprehensive projections specific to Kodiak Sciences Inc. (KOD).
- Time-Saving and Accurate: Eliminate the need to build models from scratch while ensuring precision and flexibility in your evaluations.
Key Features
- Comprehensive DCF Calculator: Features both unlevered and levered DCF valuation models tailored for Kodiak Sciences Inc. (KOD).
- WACC Calculator: Includes a pre-configured Weighted Average Cost of Capital sheet with adjustable parameters.
- Customizable Forecast Assumptions: Easily alter growth rates, capital expenditures, and discount rates.
- Integrated Financial Ratios: Evaluate profitability, leverage, and efficiency ratios specific to Kodiak Sciences Inc. (KOD).
- Visual Dashboard and Charts: Graphical representations provide a clear summary of essential valuation metrics for straightforward analysis.
How It Functions
- Download the Template: Gain immediate access to the Excel-based KOD DCF Calculator.
- Input Your Assumptions: Modify the yellow-highlighted cells for growth rates, WACC, margins, and other parameters.
- Instant Calculations: The model automatically refreshes Kodiak Sciences' intrinsic value.
- Test Scenarios: Experiment with various assumptions to assess potential changes in valuation.
- Analyze and Decide: Utilize the results to inform your investment or financial analysis.
Why Choose This Calculator?
- User-Friendly Interface: Tailored for both novices and seasoned professionals.
- Customizable Inputs: Modify assumptions effortlessly to suit your analysis needs.
- Real-Time Updates: Observe immediate changes to Kodiak Sciences Inc.’s valuation as you tweak inputs.
- Preloaded Data: Comes with Kodiak Sciences Inc.’s actual financial metrics for swift evaluations.
- Relied Upon by Experts: Utilized by investors and analysts for making well-informed choices.
Who Should Use This Product?
- Investors: Accurately assess Kodiak Sciences Inc.’s (KOD) fair value prior to making investment choices.
- CFOs: Utilize a professional-grade DCF model for financial analysis and reporting related to Kodiak Sciences Inc. (KOD).
- Consultants: Easily modify the template for valuation reports tailored to clients interested in Kodiak Sciences Inc. (KOD).
- Entrepreneurs: Acquire insights into financial modeling practices employed by leading biotech firms like Kodiak Sciences Inc. (KOD).
- Educators: Implement it as a teaching resource to illustrate valuation techniques relevant to Kodiak Sciences Inc. (KOD).
What the Template Contains
- Pre-Filled DCF Model: Kodiak Sciences Inc.'s (KOD) financial data preloaded for immediate use.
- WACC Calculator: Detailed calculations for Weighted Average Cost of Capital.
- Financial Ratios: Evaluate Kodiak Sciences Inc.'s (KOD) profitability, leverage, and efficiency.
- Editable Inputs: Change assumptions such as growth, margins, and CAPEX to fit your scenarios.
- Financial Statements: Annual and quarterly reports to support detailed analysis.
- Interactive Dashboard: Easily visualize key valuation metrics and results.
Disclaimer
All information, articles, and product details provided on this website are for general informational and educational purposes only. We do not claim any ownership over, nor do we intend to infringe upon, any trademarks, copyrights, logos, brand names, or other intellectual property mentioned or depicted on this site. Such intellectual property remains the property of its respective owners, and any references here are made solely for identification or informational purposes, without implying any affiliation, endorsement, or partnership.
We make no representations or warranties, express or implied, regarding the accuracy, completeness, or suitability of any content or products presented. Nothing on this website should be construed as legal, tax, investment, financial, medical, or other professional advice. In addition, no part of this site—including articles or product references—constitutes a solicitation, recommendation, endorsement, advertisement, or offer to buy or sell any securities, franchises, or other financial instruments, particularly in jurisdictions where such activity would be unlawful.
All content is of a general nature and may not address the specific circumstances of any individual or entity. It is not a substitute for professional advice or services. Any actions you take based on the information provided here are strictly at your own risk. You accept full responsibility for any decisions or outcomes arising from your use of this website and agree to release us from any liability in connection with your use of, or reliance upon, the content or products found herein.