
|
Keros Therapeutics, Inc. (KROS) Évaluation DCF |
Entièrement Modifiable: Adapté À Vos Besoins Dans Excel Ou Sheets
Conception Professionnelle: Modèles Fiables Et Conformes Aux Normes Du Secteur
Pré-Construits Pour Une Utilisation Rapide Et Efficace
Compatible MAC/PC, entièrement débloqué
Aucune Expertise N'Est Requise; Facile À Suivre
Keros Therapeutics, Inc. (KROS) Bundle
Rationalisez votre analyse et améliorez la précision avec notre calculatrice [KROS] DCF! En utilisant des données réelles de Keros Therapeutics, Inc. et des hypothèses personnalisables, cet outil vous permet de prévoir, analyser et valoriser les thérapies Keros comme un investisseur expert.
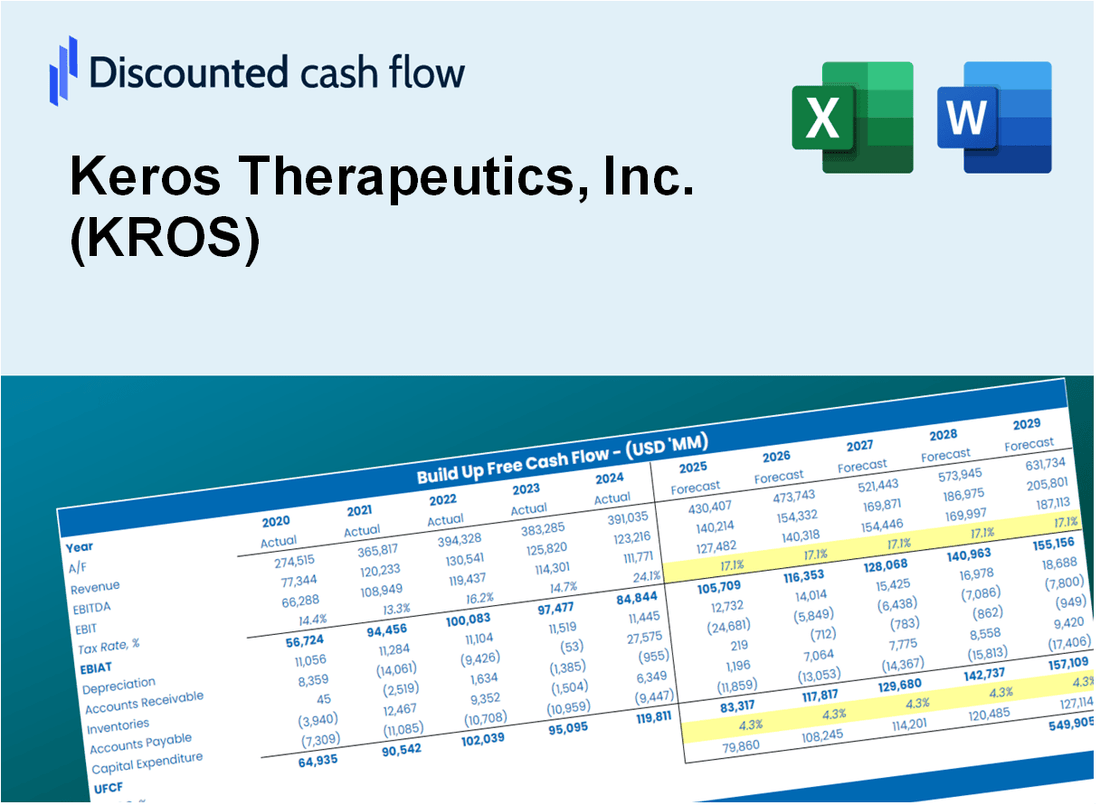
Discounted Cash Flow (DCF) - (USD MM)
| Year | AY1 2020 |
AY2 2021 |
AY3 2022 |
AY4 2023 |
AY5 2024 |
FY1 2025 |
FY2 2026 |
FY3 2027 |
FY4 2028 |
FY5 2029 |
|---|---|---|---|---|---|---|---|---|---|---|
| Revenue | .0 | 20.1 | .0 | .2 | 3.6 | 3.6 | 3.6 | 3.6 | 3.6 | 3.6 |
| Revenue Growth, % | 0 | 0 | -100 | 0 | 2250.99 | 0 | 0 | 0 | 0 | 0 |
| EBITDA | -44.9 | -56.4 | -104.0 | -152.2 | -185.8 | -.7 | -.7 | -.7 | -.7 | -.7 |
| EBITDA, % | 100 | -280.35 | 100 | -100779.47 | -5234.48 | -20 | -20 | -20 | -20 | -20 |
| Depreciation | .6 | .4 | .7 | .8 | 1.2 | 2.4 | 2.4 | 2.4 | 2.4 | 2.4 |
| Depreciation, % | 100 | 1.88 | 100 | 539.74 | 34.62 | 67.3 | 67.3 | 67.3 | 67.3 | 67.3 |
| EBIT | -45.5 | -56.7 | -104.7 | -153.0 | -187.1 | -.7 | -.7 | -.7 | -.7 | -.7 |
| EBIT, % | 100 | -282.23 | 100 | -101319.21 | -5269.1 | -20 | -20 | -20 | -20 | -20 |
| Total Cash | 265.9 | 230.0 | 279.0 | 331.1 | 559.9 | 3.6 | 3.6 | 3.6 | 3.6 | 3.6 |
| Total Cash, percent | .0 | .0 | .0 | .2 | .0 | .0 | .0 | .0 | .0 | .0 |
| Account Receivables | .2 | 18.2 | .8 | 1.1 | 4.5 | 3.5 | 3.5 | 3.5 | 3.5 | 3.5 |
| Account Receivables, % | 100 | 90.53 | 100 | 722.52 | 125.52 | 98.11 | 98.11 | 98.11 | 98.11 | 98.11 |
| Inventories | .0 | .0 | .0 | .0 | .0 | 1.4 | 1.4 | 1.4 | 1.4 | 1.4 |
| Inventories, % | 100 | 0 | 100 | 0 | 0 | 40 | 40 | 40 | 40 | 40 |
| Accounts Payable | 2.1 | 3.6 | 3.3 | 5.5 | 4.6 | 3.0 | 3.0 | 3.0 | 3.0 | 3.0 |
| Accounts Payable, % | 100 | 18.13 | 100 | 3609.27 | 129.63 | 83.63 | 83.63 | 83.63 | 83.63 | 83.63 |
| Capital Expenditure | -.3 | -1.0 | -1.2 | -2.5 | -1.9 | -1.1 | -1.1 | -1.1 | -1.1 | -1.1 |
| Capital Expenditure, % | 100 | -5.09 | 100 | -1631.79 | -54.39 | -31.9 | -31.9 | -31.9 | -31.9 | -31.9 |
| Tax Rate, % | -0.16038 | -0.16038 | -0.16038 | -0.16038 | -0.16038 | -0.16038 | -0.16038 | -0.16038 | -0.16038 | -0.16038 |
| EBITAT | -45.4 | -58.7 | -104.7 | -153.0 | -187.4 | -.7 | -.7 | -.7 | -.7 | -.7 |
| Depreciation | ||||||||||
| Changes in Account Receivables | ||||||||||
| Changes in Inventories | ||||||||||
| Changes in Accounts Payable | ||||||||||
| Capital Expenditure | ||||||||||
| UFCF | -43.1 | -75.9 | -88.2 | -152.8 | -192.3 | -1.5 | .5 | .5 | .5 | .5 |
| WACC, % | 7.92 | 7.92 | 7.92 | 7.92 | 7.92 | 7.92 | 7.92 | 7.92 | 7.92 | 7.92 |
| PV UFCF | ||||||||||
| SUM PV UFCF | .3 | |||||||||
| Long Term Growth Rate, % | 2.00 | |||||||||
| Free cash flow (T + 1) | 1 | |||||||||
| Terminal Value | 9 | |||||||||
| Present Terminal Value | 6 | |||||||||
| Enterprise Value | 7 | |||||||||
| Net Debt | -541 | |||||||||
| Equity Value | 548 | |||||||||
| Diluted Shares Outstanding, MM | 37 | |||||||||
| Equity Value Per Share | 14.63 |
What You Will Get
- Editable Excel Template: A fully customizable Excel-based DCF Calculator featuring pre-filled real KROS financials.
- Real-World Data: Historical data and forward-looking estimates (highlighted in the yellow cells).
- Forecast Flexibility: Adjust forecast assumptions such as revenue growth, EBITDA %, and WACC.
- Automatic Calculations: Instantly observe the effect of your inputs on Keros Therapeutics’ valuation.
- Professional Tool: Designed for investors, CFOs, consultants, and financial analysts.
- User-Friendly Design: Organized for clarity and ease of use, complete with step-by-step instructions.
Key Features
- 🔍 Real-Life KROS Financials: Pre-filled historical and projected data for Keros Therapeutics, Inc. (KROS).
- ✏️ Fully Customizable Inputs: Adjust all critical parameters (yellow cells) like WACC, growth %, and tax rates.
- 📊 Professional DCF Valuation: Built-in formulas calculate Keros Therapeutics’ intrinsic value using the Discounted Cash Flow method.
- ⚡ Instant Results: Visualize Keros Therapeutics’ valuation instantly after making changes.
- Scenario Analysis: Test and compare outcomes for various financial assumptions side-by-side.
How It Works
- Step 1: Download the prebuilt Excel template with Keros Therapeutics' (KROS) data included.
- Step 2: Explore the pre-filled sheets and familiarize yourself with the key metrics.
- Step 3: Update forecasts and assumptions in the editable yellow cells (WACC, growth, margins).
- Step 4: Instantly view recalculated results, including Keros Therapeutics' intrinsic value.
- Step 5: Make informed investment decisions or generate reports using the outputs.
Why Choose Keros Therapeutics, Inc. (KROS)?
- Innovative Solutions: Cutting-edge therapies designed to address unmet medical needs.
- Commitment to Quality: Rigorous research and development processes ensure high standards.
- Collaborative Approach: Partnerships with leading organizations to enhance treatment options.
- Patient-Centric Focus: Our mission is to improve the lives of patients through targeted therapies.
- Proven Expertise: A team of experienced professionals dedicated to advancing healthcare.
Who Should Use This Product?
- Investors: Evaluate Keros Therapeutics’ valuation before making investment decisions.
- CFOs and Financial Analysts: Optimize valuation methodologies and assess future projections.
- Startup Founders: Understand how biotech firms like Keros Therapeutics are appraised.
- Consultants: Provide detailed valuation analyses for client projects.
- Students and Educators: Utilize real-world examples to study and teach valuation strategies.
What the Template Contains
- Historical Data: Includes Keros Therapeutics' past financials and baseline forecasts.
- DCF and Levered DCF Models: Detailed templates to calculate Keros Therapeutics' intrinsic value.
- WACC Sheet: Pre-built calculations for Weighted Average Cost of Capital.
- Editable Inputs: Modify key drivers like growth rates, EBITDA %, and CAPEX assumptions.
- Quarterly and Annual Statements: A complete breakdown of Keros Therapeutics' financials.
- Interactive Dashboard: Visualize valuation results and projections dynamically.
Disclaimer
All information, articles, and product details provided on this website are for general informational and educational purposes only. We do not claim any ownership over, nor do we intend to infringe upon, any trademarks, copyrights, logos, brand names, or other intellectual property mentioned or depicted on this site. Such intellectual property remains the property of its respective owners, and any references here are made solely for identification or informational purposes, without implying any affiliation, endorsement, or partnership.
We make no representations or warranties, express or implied, regarding the accuracy, completeness, or suitability of any content or products presented. Nothing on this website should be construed as legal, tax, investment, financial, medical, or other professional advice. In addition, no part of this site—including articles or product references—constitutes a solicitation, recommendation, endorsement, advertisement, or offer to buy or sell any securities, franchises, or other financial instruments, particularly in jurisdictions where such activity would be unlawful.
All content is of a general nature and may not address the specific circumstances of any individual or entity. It is not a substitute for professional advice or services. Any actions you take based on the information provided here are strictly at your own risk. You accept full responsibility for any decisions or outcomes arising from your use of this website and agree to release us from any liability in connection with your use of, or reliance upon, the content or products found herein.