
|
Kennedy-Wilson Holdings, Inc. (KW) Évaluation DCF |
Entièrement Modifiable: Adapté À Vos Besoins Dans Excel Ou Sheets
Conception Professionnelle: Modèles Fiables Et Conformes Aux Normes Du Secteur
Pré-Construits Pour Une Utilisation Rapide Et Efficace
Compatible MAC/PC, entièrement débloqué
Aucune Expertise N'Est Requise; Facile À Suivre
Kennedy-Wilson Holdings, Inc. (KW) Bundle
Simplifiez l'évaluation Kennedy-Wilson Holdings, Inc. (KW) avec cette calculatrice DCF personnalisable! Doté de Real Kennedy-Wilson Holdings, Inc. (KW) Financials and Adjustable Forecast Intarts, vous pouvez tester des scénarios et découvrir la juste valeur Kennedy-Wilson Holdings, Inc. (KW) en minutes.
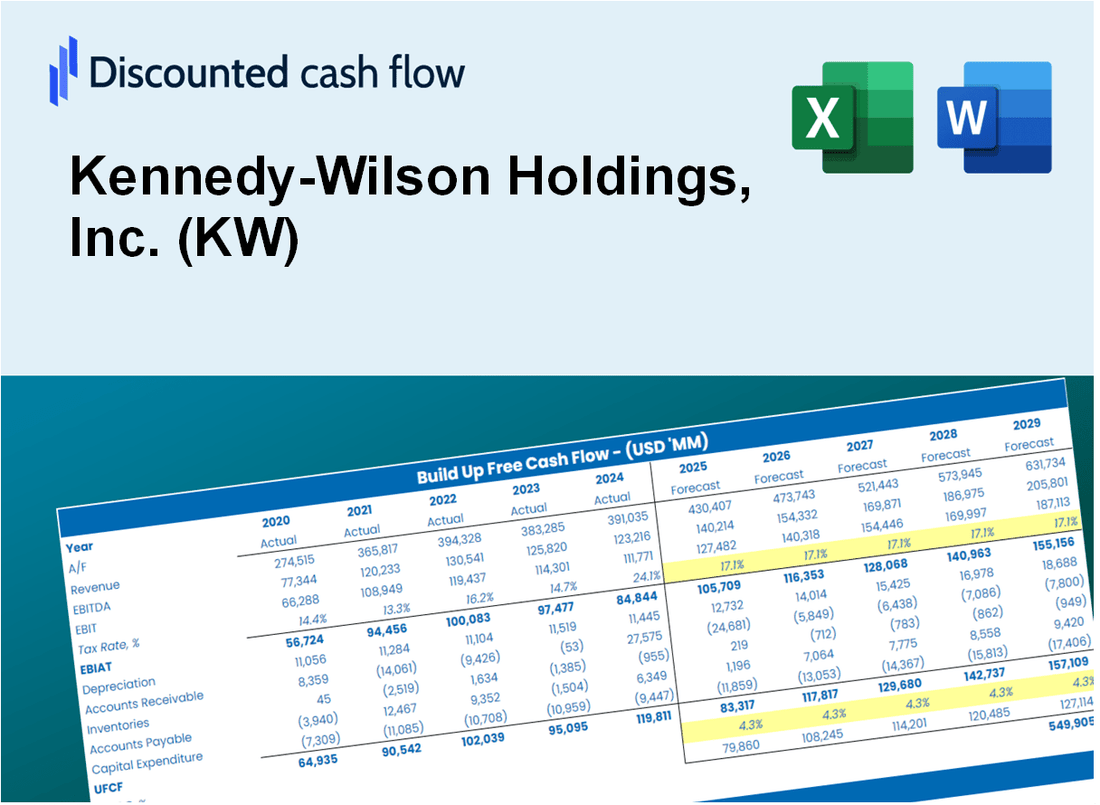
Discounted Cash Flow (DCF) - (USD MM)
| Year | AY1 2020 |
AY2 2021 |
AY3 2022 |
AY4 2023 |
AY5 2024 |
FY1 2025 |
FY2 2026 |
FY3 2027 |
FY4 2028 |
FY5 2029 |
|---|---|---|---|---|---|---|---|---|---|---|
| Revenue | 454.0 | 453.6 | 540.0 | 562.6 | 531.4 | 554.8 | 579.2 | 604.7 | 631.3 | 659.1 |
| Revenue Growth, % | 0 | -0.08810573 | 19.05 | 4.19 | -5.55 | 4.4 | 4.4 | 4.4 | 4.4 | 4.4 |
| EBITDA | 532.9 | 821.3 | 531.8 | 80.3 | 385.9 | 427.6 | 446.4 | 466.0 | 486.6 | 508.0 |
| EBITDA, % | 117.38 | 181.06 | 98.48 | 14.27 | 72.62 | 77.07 | 77.07 | 77.07 | 77.07 | 77.07 |
| Depreciation | 179.6 | 166.3 | 172.9 | 157.8 | 148.3 | 182.2 | 190.2 | 198.6 | 207.3 | 216.4 |
| Depreciation, % | 39.56 | 36.66 | 32.02 | 28.05 | 27.91 | 32.84 | 32.84 | 32.84 | 32.84 | 32.84 |
| EBIT | 353.3 | 655.0 | 358.9 | -77.5 | 237.6 | 305.4 | 318.8 | 332.8 | 347.5 | 362.8 |
| EBIT, % | 77.82 | 144.4 | 66.46 | -13.78 | 44.71 | 55.04 | 55.04 | 55.04 | 55.04 | 55.04 |
| Total Cash | 965.1 | 524.8 | 439.3 | 313.7 | 217.5 | 419.5 | 437.9 | 457.2 | 477.3 | 498.3 |
| Total Cash, percent | .0 | .0 | .0 | .0 | .0 | .0 | .0 | .0 | .0 | .0 |
| Account Receivables | 216.8 | 218.7 | 241.8 | 359.3 | 318.2 | 293.5 | 306.4 | 319.9 | 333.9 | 348.6 |
| Account Receivables, % | 47.75 | 48.21 | 44.78 | 63.86 | 59.88 | 52.9 | 52.9 | 52.9 | 52.9 | 52.9 |
| Inventories | .0 | .0 | .0 | .0 | .0 | .0 | .0 | .0 | .0 | .0 |
| Inventories, % | 0 | 0 | 0 | 0 | 0 | 0 | 0 | 0 | 0 | 0 |
| Accounts Payable | 30.1 | 18.6 | 16.2 | 17.9 | 10.8 | 21.0 | 21.9 | 22.9 | 23.9 | 25.0 |
| Accounts Payable, % | 6.63 | 4.1 | 3 | 3.18 | 2.03 | 3.79 | 3.79 | 3.79 | 3.79 | 3.79 |
| Capital Expenditure | -194.1 | -139.2 | -160.9 | -217.2 | -131.6 | -184.9 | -193.0 | -201.5 | -210.4 | -219.6 |
| Capital Expenditure, % | -42.75 | -30.69 | -29.8 | -38.61 | -24.76 | -33.32 | -33.32 | -33.32 | -33.32 | -33.32 |
| Tax Rate, % | -40.43 | -40.43 | -40.43 | -40.43 | -40.43 | -40.43 | -40.43 | -40.43 | -40.43 | -40.43 |
| EBITAT | 256.9 | 467.8 | 243.5 | -69.9 | 333.7 | 245.7 | 256.5 | 267.7 | 279.5 | 291.8 |
| Depreciation | ||||||||||
| Changes in Account Receivables | ||||||||||
| Changes in Inventories | ||||||||||
| Changes in Accounts Payable | ||||||||||
| Capital Expenditure | ||||||||||
| UFCF | 55.7 | 481.5 | 230.0 | -245.1 | 384.4 | 277.9 | 241.7 | 252.3 | 263.4 | 275.0 |
| WACC, % | 5.03 | 4.97 | 4.82 | 5.78 | 6.2 | 5.36 | 5.36 | 5.36 | 5.36 | 5.36 |
| PV UFCF | ||||||||||
| SUM PV UFCF | 1,122.8 | |||||||||
| Long Term Growth Rate, % | 2.00 | |||||||||
| Free cash flow (T + 1) | 281 | |||||||||
| Terminal Value | 8,347 | |||||||||
| Present Terminal Value | 6,429 | |||||||||
| Enterprise Value | 7,552 | |||||||||
| Net Debt | 4,567 | |||||||||
| Equity Value | 2,985 | |||||||||
| Diluted Shares Outstanding, MM | 138 | |||||||||
| Equity Value Per Share | 21.66 |
What You Will Get
- Editable Forecast Inputs: Effortlessly modify assumptions (growth %, margins, WACC) to explore various scenarios.
- Real-World Data: Kennedy-Wilson Holdings, Inc. (KW)’s financial data pre-loaded to kickstart your analysis.
- Automatic DCF Outputs: The template computes Net Present Value (NPV) and intrinsic value automatically.
- Customizable and Professional: A refined Excel model tailored to meet your valuation requirements.
- Built for Analysts and Investors: Perfect for evaluating projections, confirming strategies, and enhancing efficiency.
Key Features
- Accurate Kennedy-Wilson Financials: Gain access to reliable pre-loaded historical data and future forecasts.
- Adjustable Forecast Parameters: Modify highlighted fields such as WACC, growth rates, and profit margins.
- Real-Time Calculations: Instant updates for DCF, Net Present Value (NPV), and cash flow assessments.
- User-Friendly Dashboard: Clear charts and summaries for easy visualization of your valuation findings.
- Designed for All Skill Levels: An intuitive layout tailored for investors, CFOs, and consultants alike.
How It Works
- Step 1: Download the Excel file for Kennedy-Wilson Holdings, Inc. (KW).
- Step 2: Review the pre-filled financial data and forecasts for Kennedy-Wilson.
- Step 3: Adjust key inputs such as revenue growth, WACC, and tax rates (highlighted cells).
- Step 4: Observe the DCF model refresh in real-time as you modify your assumptions.
- Step 5: Evaluate the outputs and leverage the results for your investment strategies.
Why Choose Kennedy-Wilson Holdings, Inc. (KW)?
- Time Efficiency: Skip the hassle of building a financial model from the ground up – our tools are ready to go.
- Enhanced Precision: Dependable financial insights and calculations minimize valuation inaccuracies.
- Completely Customizable: Adjust the model to align with your specific assumptions and forecasts.
- User-Friendly: Intuitive charts and outputs simplify the analysis of results.
- Endorsed by Professionals: Crafted for experts who prioritize accuracy and functionality.
Who Should Use This Product?
- Individual Investors: Make informed decisions about buying or selling Kennedy-Wilson Holdings, Inc. (KW).
- Financial Analysts: Streamline valuation processes with ready-to-use financial models specific to Kennedy-Wilson Holdings, Inc. (KW).
- Consultants: Deliver professional valuation insights on Kennedy-Wilson Holdings, Inc. (KW) to clients quickly and accurately.
- Business Owners: Understand how real estate investment firms like Kennedy-Wilson Holdings, Inc. (KW) are valued to guide your own strategy.
- Finance Students: Learn valuation techniques using real-world data and scenarios related to Kennedy-Wilson Holdings, Inc. (KW).
What the Template Contains
- Operating and Balance Sheet Data: Pre-filled Kennedy-Wilson Holdings, Inc. (KW) historical data and forecasts, including revenue, EBITDA, EBIT, and capital expenditures.
- WACC Calculation: A dedicated sheet for Weighted Average Cost of Capital (WACC), including parameters like Beta, risk-free rate, and share price.
- DCF Valuation (Unlevered and Levered): Editable Discounted Cash Flow models showing intrinsic value with detailed calculations.
- Financial Statements: Pre-loaded financial statements (annual and quarterly) to support analysis.
- Key Ratios: Includes profitability, leverage, and efficiency ratios for Kennedy-Wilson Holdings, Inc. (KW).
- Dashboard and Charts: Visual summary of valuation outputs and assumptions to analyze results easily.
Disclaimer
All information, articles, and product details provided on this website are for general informational and educational purposes only. We do not claim any ownership over, nor do we intend to infringe upon, any trademarks, copyrights, logos, brand names, or other intellectual property mentioned or depicted on this site. Such intellectual property remains the property of its respective owners, and any references here are made solely for identification or informational purposes, without implying any affiliation, endorsement, or partnership.
We make no representations or warranties, express or implied, regarding the accuracy, completeness, or suitability of any content or products presented. Nothing on this website should be construed as legal, tax, investment, financial, medical, or other professional advice. In addition, no part of this site—including articles or product references—constitutes a solicitation, recommendation, endorsement, advertisement, or offer to buy or sell any securities, franchises, or other financial instruments, particularly in jurisdictions where such activity would be unlawful.
All content is of a general nature and may not address the specific circumstances of any individual or entity. It is not a substitute for professional advice or services. Any actions you take based on the information provided here are strictly at your own risk. You accept full responsibility for any decisions or outcomes arising from your use of this website and agree to release us from any liability in connection with your use of, or reliance upon, the content or products found herein.