
|
Lifestance Health Group, Inc. (LFST) Évaluation DCF |
Entièrement Modifiable: Adapté À Vos Besoins Dans Excel Ou Sheets
Conception Professionnelle: Modèles Fiables Et Conformes Aux Normes Du Secteur
Pré-Construits Pour Une Utilisation Rapide Et Efficace
Compatible MAC/PC, entièrement débloqué
Aucune Expertise N'Est Requise; Facile À Suivre
LifeStance Health Group, Inc. (LFST) Bundle
Simplifier Lifestance Health Group, Inc. (LFST) Valation avec cette calculatrice DCF personnalisable! Doté de véritables aliments financiers de vie et de prévisions réglables, vous pouvez tester des scénarios et découvrir la juste valeur de la vie en quelques minutes.
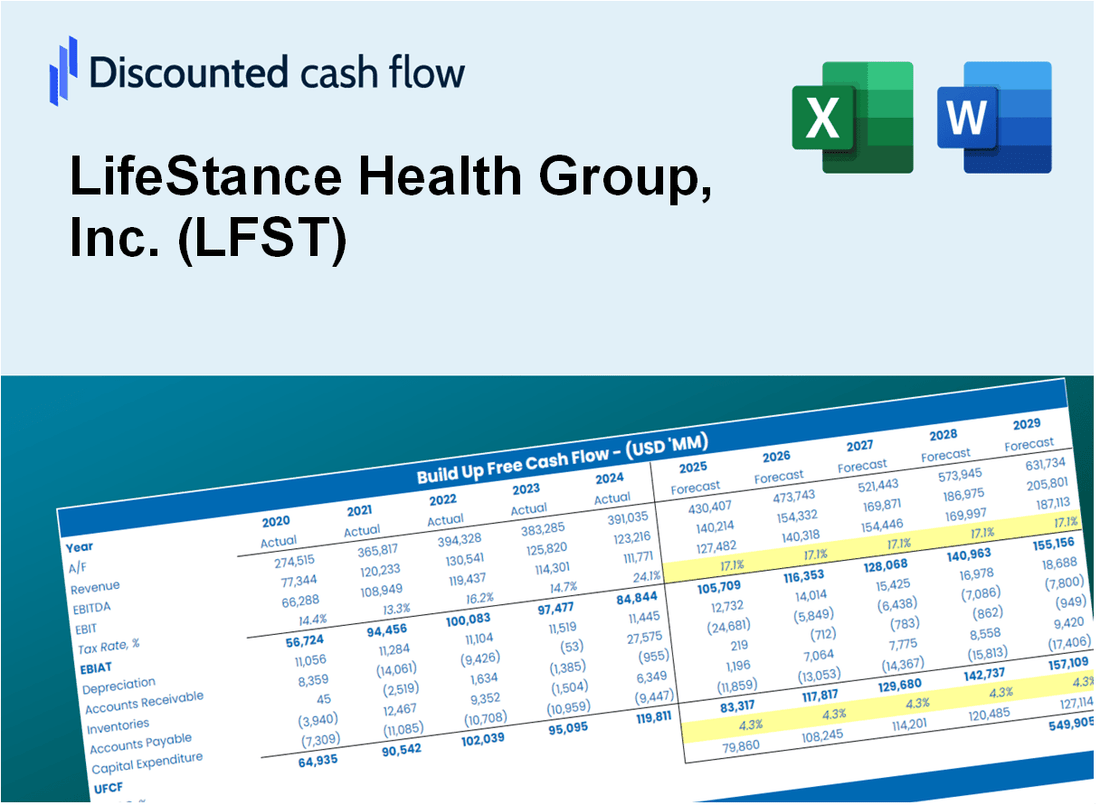
Discounted Cash Flow (DCF) - (USD MM)
| Year | AY1 2020 |
AY2 2021 |
AY3 2022 |
AY4 2023 |
AY5 2024 |
FY1 2025 |
FY2 2026 |
FY3 2027 |
FY4 2028 |
FY5 2029 |
|---|---|---|---|---|---|---|---|---|---|---|
| Revenue | 377.2 | 667.5 | 859.5 | 1,055.7 | 1,251.0 | 1,710.8 | 2,339.8 | 3,199.9 | 4,376.1 | 5,984.9 |
| Revenue Growth, % | 0 | 76.96 | 28.77 | 22.82 | 18.5 | 36.76 | 36.76 | 36.76 | 36.76 | 36.76 |
| EBITDA | 8.8 | -240.1 | -143.6 | -104.9 | 39.9 | -195.4 | -267.2 | -365.4 | -499.7 | -683.5 |
| EBITDA, % | 2.32 | -35.96 | -16.71 | -9.94 | 3.19 | -11.42 | -11.42 | -11.42 | -11.42 | -11.42 |
| Depreciation | 31.0 | 54.1 | 69.2 | 80.4 | 71.0 | 128.9 | 176.3 | 241.2 | 329.8 | 451.0 |
| Depreciation, % | 8.23 | 8.11 | 8.05 | 7.62 | 5.67 | 7.54 | 7.54 | 7.54 | 7.54 | 7.54 |
| EBIT | -22.3 | -294.2 | -212.8 | -185.4 | -31.1 | -324.3 | -443.5 | -606.6 | -829.5 | -1,134.5 |
| EBIT, % | -5.91 | -44.07 | -24.76 | -17.56 | -2.48 | -18.96 | -18.96 | -18.96 | -18.96 | -18.96 |
| Total Cash | 18.8 | 148.0 | 108.6 | 78.8 | 154.6 | 204.0 | 279.0 | 381.6 | 521.9 | 713.7 |
| Total Cash, percent | .0 | .0 | .0 | .0 | .0 | .0 | .0 | .0 | .0 | .0 |
| Account Receivables | 43.7 | 99.3 | 101.5 | 125.6 | 132.0 | 207.8 | 284.2 | 388.6 | 531.5 | 726.9 |
| Account Receivables, % | 11.59 | 14.88 | 11.81 | 11.9 | 10.55 | 12.15 | 12.15 | 12.15 | 12.15 | 12.15 |
| Inventories | .0 | 38.1 | .0 | .0 | .0 | 19.5 | 26.7 | 36.5 | 49.9 | 68.3 |
| Inventories, % | 0 | 5.7 | 0 | 0 | 0 | 1.14 | 1.14 | 1.14 | 1.14 | 1.14 |
| Accounts Payable | 7.7 | 14.2 | 24.4 | 23.2 | 7.2 | 33.4 | 45.7 | 62.5 | 85.5 | 117.0 |
| Accounts Payable, % | 2.04 | 2.12 | 2.84 | 2.2 | 0.57891 | 1.95 | 1.95 | 1.95 | 1.95 | 1.95 |
| Capital Expenditure | -38.1 | -94.5 | -79.3 | -40.5 | -21.6 | -133.5 | -182.6 | -249.8 | -341.6 | -467.2 |
| Capital Expenditure, % | -10.09 | -14.16 | -9.22 | -3.84 | -1.72 | -7.81 | -7.81 | -7.81 | -7.81 | -7.81 |
| Tax Rate, % | 0.29507 | 0.29507 | 0.29507 | 0.29507 | 0.29507 | 0.29507 | 0.29507 | 0.29507 | 0.29507 | 0.29507 |
| EBITAT | -19.1 | -271.3 | -197.1 | -167.1 | -31.0 | -298.6 | -408.4 | -558.6 | -763.9 | -1,044.7 |
| Depreciation | ||||||||||
| Changes in Account Receivables | ||||||||||
| Changes in Inventories | ||||||||||
| Changes in Accounts Payable | ||||||||||
| Capital Expenditure | ||||||||||
| UFCF | -62.1 | -398.9 | -161.1 | -152.5 | -4.0 | -372.4 | -486.0 | -664.7 | -909.0 | -1,243.2 |
| WACC, % | 8.43 | 8.49 | 8.49 | 8.47 | 8.56 | 8.49 | 8.49 | 8.49 | 8.49 | 8.49 |
| PV UFCF | ||||||||||
| SUM PV UFCF | -2,760.2 | |||||||||
| Long Term Growth Rate, % | 2.00 | |||||||||
| Free cash flow (T + 1) | -1,268 | |||||||||
| Terminal Value | -19,546 | |||||||||
| Present Terminal Value | -13,007 | |||||||||
| Enterprise Value | -15,767 | |||||||||
| Net Debt | 331 | |||||||||
| Equity Value | -16,097 | |||||||||
| Diluted Shares Outstanding, MM | 379 | |||||||||
| Equity Value Per Share | -42.46 |
What You Will Receive
- Comprehensive Financial Model: LifeStance's actual data facilitates accurate DCF valuation.
- Complete Forecast Control: Modify revenue growth, profit margins, WACC, and other essential metrics.
- Real-Time Calculations: Automatic updates provide immediate results as you adjust inputs.
- Professional-Grade Template: A polished Excel file crafted for high-quality valuation.
- Flexible and Reusable: Designed for adaptability, making it suitable for ongoing detailed forecasts.
Key Features
- Comprehensive Patient Data: Access reliable, pre-loaded historical patient metrics and future growth forecasts.
- Adjustable Care Parameters: Modify highlighted fields for patient engagement strategies, service costs, and growth rates.
- Real-Time Analytics: Automatic updates to patient outcomes, operational efficiency, and financial performance metrics.
- Interactive Dashboard: User-friendly visuals and summaries to easily interpret your healthcare performance results.
- Designed for All Users: A straightforward, intuitive layout tailored for healthcare professionals, administrators, and analysts.
How It Works
- Step 1: Download the Excel file.
- Step 2: Review LifeStance Health Group's pre-filled financial data and forecasts.
- Step 3: Modify key inputs such as patient growth, operating margins, and reimbursement rates (highlighted cells).
- Step 4: Observe the DCF model update in real-time as you adjust your assumptions.
- Step 5: Evaluate the outputs and leverage the results for your investment strategies.
Why Choose LifeStance Health Group, Inc. (LFST)?
- Comprehensive Care: Access a wide range of mental health services tailored to individual needs.
- Expert Professionals: Our team consists of highly trained clinicians dedicated to delivering quality care.
- Convenient Access: Flexible appointment options including telehealth services for your convenience.
- Patient-Centered Approach: We prioritize your well-being and work collaboratively on treatment plans.
- Proven Results: Our evidence-based practices ensure effective and reliable mental health support.
Who Should Use This Product?
- Investors: Accurately assess LifeStance Health Group, Inc.'s (LFST) fair value before making investment choices.
- CFOs: Utilize a professional-grade DCF model for financial reporting and analysis related to LifeStance Health Group, Inc. (LFST).
- Consultants: Efficiently modify the template for valuation reports tailored to clients interested in LifeStance Health Group, Inc. (LFST).
- Entrepreneurs: Acquire insights into financial modeling practices employed by leading healthcare companies.
- Educators: Implement it as a teaching resource to illustrate valuation methodologies in the healthcare sector.
What the Template Contains
- Preloaded LFST Data: Historical and projected financial data, including revenue, EBIT, and capital expenditures.
- DCF and WACC Models: Professional-grade sheets for calculating intrinsic value and Weighted Average Cost of Capital.
- Editable Inputs: Yellow-highlighted cells for adjusting revenue growth, tax rates, and discount rates.
- Financial Statements: Comprehensive annual and quarterly financials for deeper analysis.
- Key Ratios: Profitability, leverage, and efficiency ratios to evaluate performance.
- Dashboard and Charts: Visual summaries of valuation outcomes and assumptions.
Disclaimer
All information, articles, and product details provided on this website are for general informational and educational purposes only. We do not claim any ownership over, nor do we intend to infringe upon, any trademarks, copyrights, logos, brand names, or other intellectual property mentioned or depicted on this site. Such intellectual property remains the property of its respective owners, and any references here are made solely for identification or informational purposes, without implying any affiliation, endorsement, or partnership.
We make no representations or warranties, express or implied, regarding the accuracy, completeness, or suitability of any content or products presented. Nothing on this website should be construed as legal, tax, investment, financial, medical, or other professional advice. In addition, no part of this site—including articles or product references—constitutes a solicitation, recommendation, endorsement, advertisement, or offer to buy or sell any securities, franchises, or other financial instruments, particularly in jurisdictions where such activity would be unlawful.
All content is of a general nature and may not address the specific circumstances of any individual or entity. It is not a substitute for professional advice or services. Any actions you take based on the information provided here are strictly at your own risk. You accept full responsibility for any decisions or outcomes arising from your use of this website and agree to release us from any liability in connection with your use of, or reliance upon, the content or products found herein.