
|
Logitech International S.A. (LOGI) Évaluation DCF |
Entièrement Modifiable: Adapté À Vos Besoins Dans Excel Ou Sheets
Conception Professionnelle: Modèles Fiables Et Conformes Aux Normes Du Secteur
Pré-Construits Pour Une Utilisation Rapide Et Efficace
Compatible MAC/PC, entièrement débloqué
Aucune Expertise N'Est Requise; Facile À Suivre
Logitech International S.A. (LOGI) Bundle
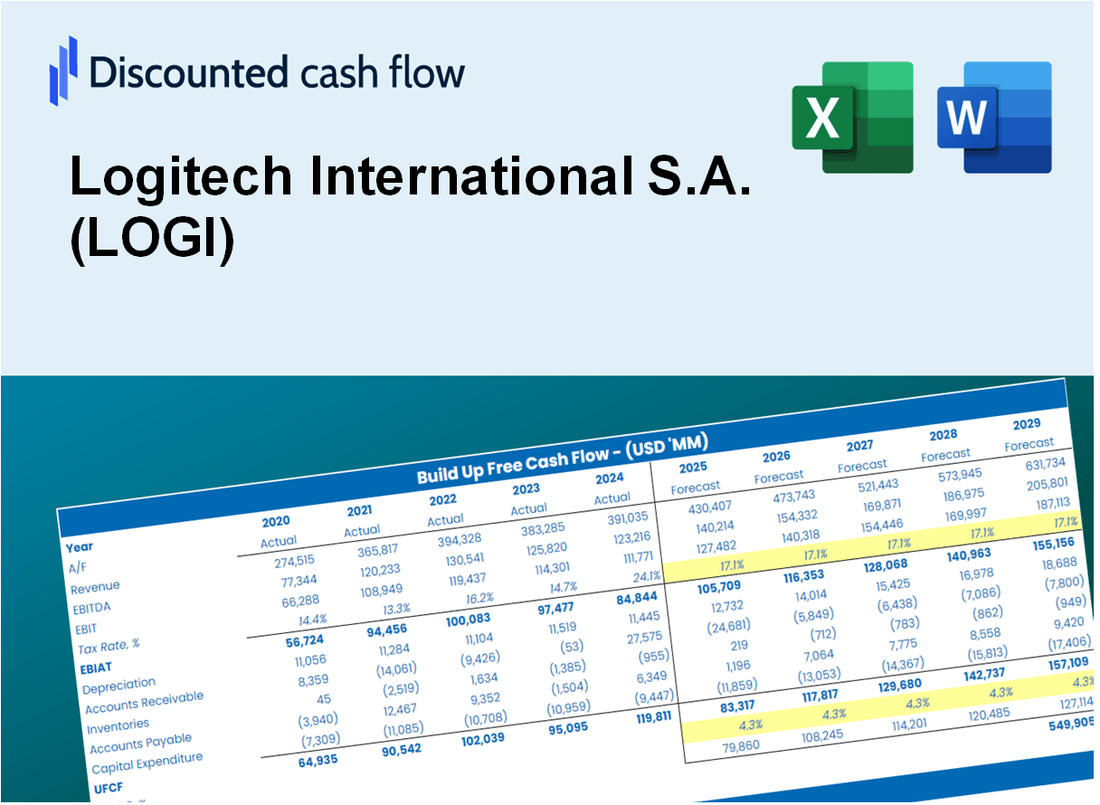
Améliorez vos choix d'investissement avec la calculatrice DCF Logitech International S.A. (LOGI)! Explorez les données financières réelles de Logitech, ajustez les hypothèses et dépenses de croissance et observez instantanément comment ces changements affectent la valeur intrinsèque de Logitech International S.A. (LOGI).
Discounted Cash Flow (DCF) - (USD MM)
| Year | AY1 2021 |
AY2 2022 |
AY3 2023 |
AY4 2024 |
AY5 2025 |
FY1 2026 |
FY2 2027 |
FY3 2028 |
FY4 2029 |
FY5 2030 |
|---|---|---|---|---|---|---|---|---|---|---|
| Revenue | 5,252.3 | 5,481.1 | 4,538.8 | 4,298.5 | 4,554.9 | 4,416.4 | 4,282.1 | 4,151.8 | 4,025.6 | 3,903.2 |
| Revenue Growth, % | 0 | 4.36 | -17.19 | -5.3 | 5.97 | -3.04 | -3.04 | -3.04 | -3.04 | -3.04 |
| EBITDA | 1,236.2 | 902.8 | 603.2 | 682.1 | 747.8 | 755.9 | 732.9 | 710.7 | 689.0 | 668.1 |
| EBITDA, % | 23.54 | 16.47 | 13.29 | 15.87 | 16.42 | 17.12 | 17.12 | 17.12 | 17.12 | 17.12 |
| Depreciation | 82.6 | 118.5 | 100.7 | 84.7 | 79.8 | 85.5 | 82.9 | 80.4 | 77.9 | 75.5 |
| Depreciation, % | 1.57 | 2.16 | 2.22 | 1.97 | 1.75 | 1.94 | 1.94 | 1.94 | 1.94 | 1.94 |
| EBIT | 1,153.6 | 784.3 | 502.5 | 597.3 | 668.1 | 670.5 | 650.1 | 630.3 | 611.1 | 592.6 |
| EBIT, % | 21.96 | 14.31 | 11.07 | 13.9 | 14.67 | 15.18 | 15.18 | 15.18 | 15.18 | 15.18 |
| Total Cash | 1,750.3 | 1,328.7 | 1,149.0 | 1,520.8 | 1,502.4 | 1,335.9 | 1,295.3 | 1,255.9 | 1,217.7 | 1,180.7 |
| Total Cash, percent | .0 | .0 | .0 | .0 | .0 | .0 | .0 | .0 | .0 | .0 |
| Account Receivables | 679.9 | 732.0 | 690.7 | 582.0 | 500.9 | 583.4 | 565.7 | 548.5 | 531.8 | 515.6 |
| Account Receivables, % | 12.95 | 13.35 | 15.22 | 13.54 | 11 | 13.21 | 13.21 | 13.21 | 13.21 | 13.21 |
| Inventories | 661.1 | 933.1 | 682.9 | 422.5 | 503.5 | 578.9 | 561.3 | 544.2 | 527.7 | 511.6 |
| Inventories, % | 12.59 | 17.02 | 15.05 | 9.83 | 11.05 | 13.11 | 13.11 | 13.11 | 13.11 | 13.11 |
| Accounts Payable | 823.2 | 634.2 | 406.1 | 447.9 | 414.4 | 492.1 | 477.1 | 462.6 | 448.5 | 434.9 |
| Accounts Payable, % | 15.67 | 11.57 | 8.95 | 10.42 | 9.1 | 11.14 | 11.14 | 11.14 | 11.14 | 11.14 |
| Capital Expenditure | -76.2 | -89.2 | -92.4 | -55.9 | -56.1 | -67.5 | -65.5 | -63.5 | -61.5 | -59.7 |
| Capital Expenditure, % | -1.45 | -1.63 | -2.03 | -1.3 | -1.23 | -1.53 | -1.53 | -1.53 | -1.53 | -1.53 |
| Tax Rate, % | 10.66 | 10.66 | 10.66 | 10.66 | 10.66 | 10.66 | 10.66 | 10.66 | 10.66 | 10.66 |
| EBITAT | 951.8 | 651.6 | 395.2 | 588.3 | 596.9 | 579.4 | 561.7 | 544.7 | 528.1 | 512.0 |
| Depreciation | ||||||||||
| Changes in Account Receivables | ||||||||||
| Changes in Inventories | ||||||||||
| Changes in Accounts Payable | ||||||||||
| Capital Expenditure | ||||||||||
| UFCF | 440.3 | 167.8 | 467.0 | 1,028.1 | 587.1 | 517.0 | 599.5 | 581.3 | 563.6 | 546.5 |
| WACC, % | 7.53 | 7.53 | 7.53 | 7.53 | 7.53 | 7.53 | 7.53 | 7.53 | 7.53 | 7.53 |
| PV UFCF | ||||||||||
| SUM PV UFCF | 2,268.7 | |||||||||
| Long Term Growth Rate, % | 2.00 | |||||||||
| Free cash flow (T + 1) | 557 | |||||||||
| Terminal Value | 10,085 | |||||||||
| Present Terminal Value | 7,016 | |||||||||
| Enterprise Value | 9,285 | |||||||||
| Net Debt | -1,410 | |||||||||
| Equity Value | 10,695 | |||||||||
| Diluted Shares Outstanding, MM | 153 | |||||||||
| Equity Value Per Share | 70.00 |
What You Will Receive
- Customizable Excel Template: A fully editable Excel-based DCF Calculator featuring pre-filled financials for Logitech International S.A. (LOGI).
- Accurate Data: Access to historical data and forward-looking projections (highlighted in the yellow cells).
- Adjustable Forecasts: Modify forecast parameters such as revenue growth, EBITDA %, and WACC.
- Instant Calculations: Quickly observe the effects of your inputs on Logitech’s valuation.
- Professional Resource: Designed for investors, CFOs, consultants, and financial analysts.
- Intuitive Layout: Organized for clarity and simplicity, complete with step-by-step guidance.
Key Features
- Comprehensive Financial Data: Logitech’s historical financial statements and pre-filled projections.
- Customizable Inputs: Modify WACC, tax rates, revenue growth, and EBITDA margins as needed.
- Real-Time Results: Observe Logitech’s intrinsic value recalculating instantly.
- Intuitive Visual Outputs: Dashboard graphs illustrate valuation results and essential metrics.
- Designed for Precision: A professional-grade tool for analysts, investors, and finance professionals.
How It Works
- Download: Get the ready-to-use Excel file featuring Logitech International S.A.'s (LOGI) financial data.
- Customize: Tailor forecasts, including revenue growth, EBITDA %, and WACC to your needs.
- Update Automatically: Watch as the intrinsic value and NPV calculations refresh in real-time.
- Test Scenarios: Generate various projections and instantly compare the results.
- Make Decisions: Utilize the valuation findings to inform your investment strategy.
Why Choose This Calculator for Logitech International S.A. (LOGI)?
- Accuracy: Utilizes real Logitech financials to ensure precise data.
- Flexibility: Tailored for users to easily test and adjust inputs as needed.
- Time-Saving: Avoid the complexities of constructing a DCF model from the ground up.
- Professional-Grade: Engineered with the precision and usability expected at the CFO level.
- User-Friendly: Intuitive interface, suitable for users without extensive financial modeling expertise.
Who Should Use This Product?
- Investors: Accurately assess Logitech's fair value before making investment choices.
- CFOs: Utilize a professional-grade DCF model for financial analysis and reporting.
- Consultants: Efficiently customize the template for client valuation reports.
- Entrepreneurs: Acquire insights into financial modeling practices of leading tech companies.
- Educators: Employ it as a teaching resource to illustrate valuation techniques.
What the Template Contains
- Pre-Filled Data: Includes Logitech’s historical financials and forecasts.
- Discounted Cash Flow Model: Editable DCF valuation model with automatic calculations.
- Weighted Average Cost of Capital (WACC): A dedicated sheet for calculating WACC based on custom inputs.
- Key Financial Ratios: Analyze Logitech’s profitability, efficiency, and leverage.
- Customizable Inputs: Edit revenue growth, margins, and tax rates with ease.
- Clear Dashboard: Charts and tables summarizing key valuation results.
Disclaimer
All information, articles, and product details provided on this website are for general informational and educational purposes only. We do not claim any ownership over, nor do we intend to infringe upon, any trademarks, copyrights, logos, brand names, or other intellectual property mentioned or depicted on this site. Such intellectual property remains the property of its respective owners, and any references here are made solely for identification or informational purposes, without implying any affiliation, endorsement, or partnership.
We make no representations or warranties, express or implied, regarding the accuracy, completeness, or suitability of any content or products presented. Nothing on this website should be construed as legal, tax, investment, financial, medical, or other professional advice. In addition, no part of this site—including articles or product references—constitutes a solicitation, recommendation, endorsement, advertisement, or offer to buy or sell any securities, franchises, or other financial instruments, particularly in jurisdictions where such activity would be unlawful.
All content is of a general nature and may not address the specific circumstances of any individual or entity. It is not a substitute for professional advice or services. Any actions you take based on the information provided here are strictly at your own risk. You accept full responsibility for any decisions or outcomes arising from your use of this website and agree to release us from any liability in connection with your use of, or reliance upon, the content or products found herein.