
|
Group des technologies d'apprentissage plc (LTG.L) Valation DCF |
Entièrement Modifiable: Adapté À Vos Besoins Dans Excel Ou Sheets
Conception Professionnelle: Modèles Fiables Et Conformes Aux Normes Du Secteur
Pré-Construits Pour Une Utilisation Rapide Et Efficace
Compatible MAC/PC, entièrement débloqué
Aucune Expertise N'Est Requise; Facile À Suivre
Learning Technologies Group plc (LTG.L) Bundle
Vous cherchez à évaluer la valeur intrinsèque de l'apprentissage des technologies PLC? Notre calculatrice LTGL DCF intègre des données réelles avec des options de personnalisation complètes, vous permettant d'affiner vos prévisions et de prendre des décisions d'investissement plus éclairées.
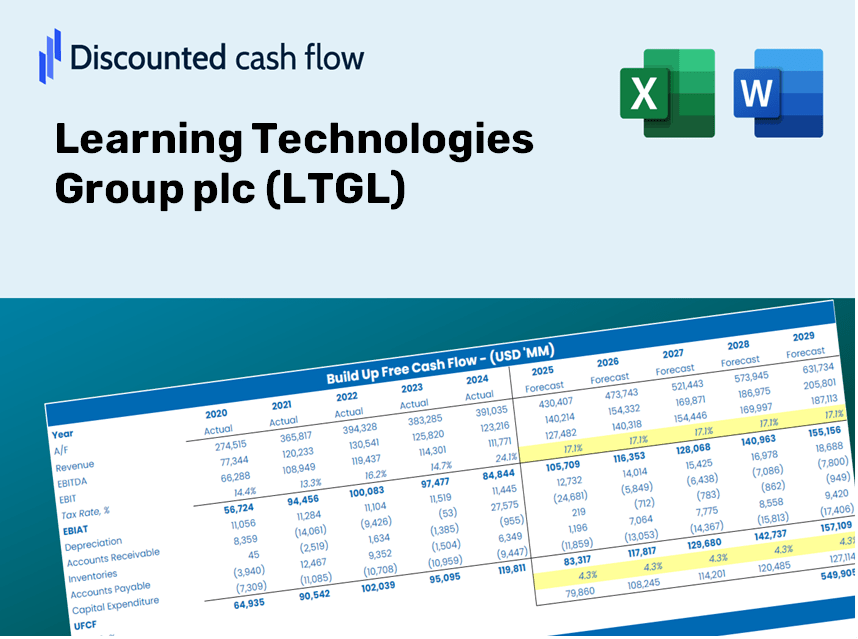
Discounted Cash Flow (DCF) - (USD MM)
| Year | AY1 2019 |
AY2 2020 |
AY3 2021 |
AY4 2022 |
AY5 2023 |
FY1 2024 |
FY2 2025 |
FY3 2026 |
FY4 2027 |
FY5 2028 |
|---|---|---|---|---|---|---|---|---|---|---|
| Revenue | 130.1 | 132.3 | 258.2 | 596.9 | 562.3 | 830.9 | 1,227.8 | 1,814.2 | 2,680.7 | 3,961.2 |
| Revenue Growth, % | 0 | 1.71 | 95.15 | 131.15 | -5.8 | 47.76 | 47.76 | 47.76 | 47.76 | 47.76 |
| EBITDA | 43.2 | 43.7 | 47.1 | 99.7 | 106.5 | 199.6 | 295.0 | 435.9 | 644.0 | 951.7 |
| EBITDA, % | 33.23 | 33.01 | 18.24 | 16.7 | 18.94 | 24.03 | 24.03 | 24.03 | 24.03 | 24.03 |
| Depreciation | 27.0 | 28.9 | 35.4 | 49.7 | 46.8 | 121.2 | 179.0 | 264.6 | 390.9 | 577.6 |
| Depreciation, % | 20.74 | 21.83 | 13.71 | 8.32 | 8.32 | 14.58 | 14.58 | 14.58 | 14.58 | 14.58 |
| EBIT | 16.3 | 14.8 | 11.7 | 50.0 | 59.7 | 78.5 | 115.9 | 171.3 | 253.1 | 374.0 |
| EBIT, % | 12.49 | 11.18 | 4.53 | 8.38 | 10.62 | 9.44 | 9.44 | 9.44 | 9.44 | 9.44 |
| Total Cash | 42.4 | 89.3 | 86.8 | 97.5 | 72.5 | 270.7 | 400.0 | 591.0 | 873.4 | 1,290.5 |
| Total Cash, percent | .0 | .0 | .0 | .0 | .0 | .0 | .0 | .0 | .0 | .0 |
| Account Receivables | 33.6 | 30.7 | 155.8 | 169.3 | 133.7 | 268.4 | 396.7 | 586.1 | 866.1 | 1,279.7 |
| Account Receivables, % | 25.85 | 23.23 | 60.32 | 28.36 | 23.78 | 32.31 | 32.31 | 32.31 | 32.31 | 32.31 |
| Inventories | .0 | .0 | 1.1 | 2.4 | 1.3 | 1.8 | 2.6 | 3.8 | 5.7 | 8.4 |
| Inventories, % | 0 | 0.000000756 | 0.42443 | 0.40744 | 0.22408 | 0.21119 | 0.21119 | 0.21119 | 0.21119 | 0.21119 |
| Accounts Payable | 1.5 | 2.3 | 39.6 | 31.8 | 25.0 | 46.6 | 68.8 | 101.7 | 150.3 | 222.1 |
| Accounts Payable, % | 1.16 | 1.76 | 15.33 | 5.33 | 4.44 | 5.61 | 5.61 | 5.61 | 5.61 | 5.61 |
| Capital Expenditure | -6.4 | -6.2 | -9.0 | -11.6 | -14.1 | -29.1 | -43.0 | -63.6 | -94.0 | -138.9 |
| Capital Expenditure, % | -4.9 | -4.71 | -3.47 | -1.94 | -2.5 | -3.51 | -3.51 | -3.51 | -3.51 | -3.51 |
| Tax Rate, % | 35.42 | 35.42 | 35.42 | 35.42 | 35.42 | 35.42 | 35.42 | 35.42 | 35.42 | 35.42 |
| EBITAT | 12.4 | 19.1 | 19.0 | 37.7 | 38.6 | 65.3 | 96.5 | 142.5 | 210.6 | 311.2 |
| Depreciation | ||||||||||
| Changes in Account Receivables | ||||||||||
| Changes in Inventories | ||||||||||
| Changes in Accounts Payable | ||||||||||
| Capital Expenditure | ||||||||||
| UFCF | .8 | 45.5 | -43.4 | 53.1 | 101.2 | 43.7 | 125.7 | 185.7 | 274.4 | 405.4 |
| WACC, % | 9.09 | 9.43 | 9.43 | 9.08 | 8.92 | 9.19 | 9.19 | 9.19 | 9.19 | 9.19 |
| PV UFCF | ||||||||||
| SUM PV UFCF | 742.3 | |||||||||
| Long Term Growth Rate, % | 2.00 | |||||||||
| Free cash flow (T + 1) | 414 | |||||||||
| Terminal Value | 5,751 | |||||||||
| Present Terminal Value | 3,705 | |||||||||
| Enterprise Value | 4,448 | |||||||||
| Net Debt | 90 | |||||||||
| Equity Value | 4,358 | |||||||||
| Diluted Shares Outstanding, MM | 818 | |||||||||
| Equity Value Per Share | 532.81 |
What You Will Receive
- Comprehensive Financial Model: Utilize Learning Technologies Group plc’s (LTGL) actual data for accurate DCF valuations.
- Complete Forecast Flexibility: Modify revenue growth, profit margins, WACC, and other essential variables.
- Real-Time Calculations: Automatic updates allow you to view results instantaneously as adjustments are made.
- Professional-Grade Template: A polished Excel file crafted for high-quality valuation presentations.
- Adaptable and Reusable: Designed for flexibility, making it suitable for multiple detailed forecasts.
Key Features
- Pre-Loaded Data: Historical financial statements and pre-filled forecasts for Learning Technologies Group plc (LTGL).
- Fully Adjustable Inputs: Customize WACC, tax rates, revenue growth, and EBITDA margins according to your analysis.
- Instant Results: View the intrinsic value of Learning Technologies Group plc (LTGL) recalculated in real time.
- Clear Visual Outputs: Dashboard charts showcase valuation results and essential metrics prominently.
- Built for Accuracy: A professional-grade tool designed for analysts, investors, and finance professionals.
How It Operates
- Download: Obtain the pre-prepared Excel file containing Learning Technologies Group plc’s (LTGL) financial data.
- Customize: Modify forecasts, such as revenue growth, EBITDA %, and WACC, to fit your analysis.
- Update Automatically: The intrinsic value and NPV calculations refresh in real-time.
- Test Scenarios: Generate various projections and instantly compare the results.
- Make Decisions: Leverage the valuation findings to shape your investment strategy.
Why Opt for This Calculator?
- Designed for Experts: A sophisticated tool utilized by analysts, CFOs, and consultants.
- Accurate Data: Historical and projected financials of Learning Technologies Group plc (LTGL) preloaded for precision.
- Scenario Simulation: Effortlessly test various forecasts and assumptions.
- Transparent Results: Automatically computes intrinsic value, NPV, and essential metrics.
- User-Friendly: Comprehensive step-by-step guidance to navigate through the calculator.
Who Can Benefit from This Product?
- Investors: Evaluate Learning Technologies Group plc’s (LTGL) valuation prior to making stock transactions.
- CFOs and Financial Analysts: Optimize valuation methodologies and assess financial projections.
- Startup Founders: Understand how leading public companies like Learning Technologies Group plc (LTGL) are appraised.
- Consultants: Provide clients with comprehensive and professional valuation reports.
- Students and Educators: Utilize actual market data to learn and teach valuation strategies.
Contents of the Template
- Detailed DCF Model: Editable template featuring extensive valuation calculations.
- Historical and Projected Data: Preloaded financial figures for Learning Technologies Group plc (LTGL) for thorough analysis.
- Flexible Parameters: Modify WACC, growth rates, and tax assumptions to explore various scenarios.
- Comprehensive Financial Statements: Annual and quarterly breakdowns for in-depth insights.
- Critical Ratios: Integrated analysis covering profitability, efficiency, and leverage metrics.
- User-Friendly Dashboard: Visual charts and tables to present clear, actionable results.
Disclaimer
All information, articles, and product details provided on this website are for general informational and educational purposes only. We do not claim any ownership over, nor do we intend to infringe upon, any trademarks, copyrights, logos, brand names, or other intellectual property mentioned or depicted on this site. Such intellectual property remains the property of its respective owners, and any references here are made solely for identification or informational purposes, without implying any affiliation, endorsement, or partnership.
We make no representations or warranties, express or implied, regarding the accuracy, completeness, or suitability of any content or products presented. Nothing on this website should be construed as legal, tax, investment, financial, medical, or other professional advice. In addition, no part of this site—including articles or product references—constitutes a solicitation, recommendation, endorsement, advertisement, or offer to buy or sell any securities, franchises, or other financial instruments, particularly in jurisdictions where such activity would be unlawful.
All content is of a general nature and may not address the specific circumstances of any individual or entity. It is not a substitute for professional advice or services. Any actions you take based on the information provided here are strictly at your own risk. You accept full responsibility for any decisions or outcomes arising from your use of this website and agree to release us from any liability in connection with your use of, or reliance upon, the content or products found herein.