
|
Lava Therapeutics N.V. (LVTX) Valation DCF |
Entièrement Modifiable: Adapté À Vos Besoins Dans Excel Ou Sheets
Conception Professionnelle: Modèles Fiables Et Conformes Aux Normes Du Secteur
Pré-Construits Pour Une Utilisation Rapide Et Efficace
Compatible MAC/PC, entièrement débloqué
Aucune Expertise N'Est Requise; Facile À Suivre
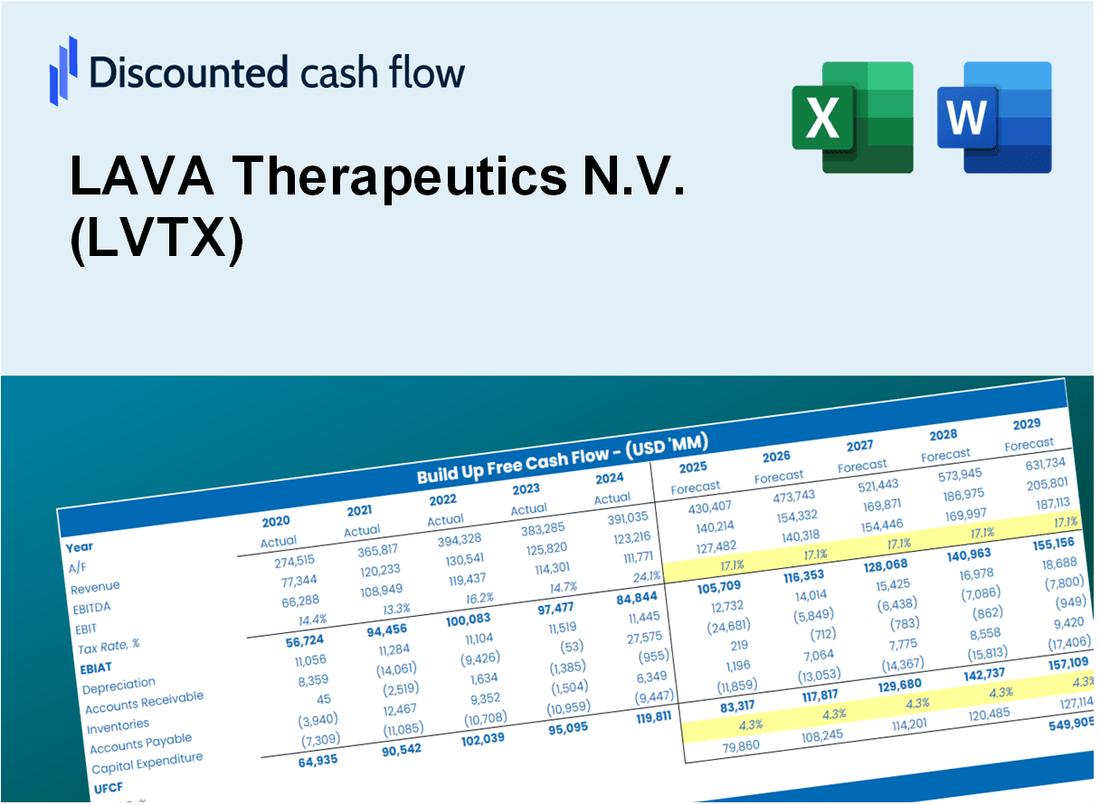
LAVA Therapeutics N.V. (LVTX) Bundle
Vous cherchez à évaluer la valeur intrinsèque de Lava Therapeutics N.V.? Notre calculatrice LVTX DCF intègre des données réelles avec des fonctionnalités de personnalisation complètes, vous permettant d'ajuster les prévisions et d'améliorer vos stratégies d'investissement.
Discounted Cash Flow (DCF) - (USD MM)
| Year | AY1 2020 |
AY2 2021 |
AY3 2022 |
AY4 2023 |
AY5 2024 |
FY1 2025 |
FY2 2026 |
FY3 2027 |
FY4 2028 |
FY5 2029 |
|---|---|---|---|---|---|---|---|---|---|---|
| Revenue | 3.7 | 5.4 | 19.4 | 6.8 | 12.0 | 16.6 | 23.0 | 32.0 | 44.3 | 61.5 |
| Revenue Growth, % | 0 | 42.78 | 262.45 | -65.09 | 77.01 | 38.68 | 38.68 | 38.68 | 38.68 | 38.68 |
| EBITDA | -14.5 | -41.0 | -30.8 | -40.5 | -23.5 | -16.6 | -23.0 | -32.0 | -44.3 | -61.5 |
| EBITDA, % | -385.91 | -766.64 | -158.81 | -598.79 | -196.14 | -100 | -100 | -100 | -100 | -100 |
| Depreciation | .2 | .6 | .8 | .6 | .5 | 1.1 | 1.5 | 2.1 | 2.9 | 4.1 |
| Depreciation, % | 5.68 | 10.43 | 4.03 | 9.04 | 3.9 | 6.62 | 6.62 | 6.62 | 6.62 | 6.62 |
| EBIT | -14.7 | -41.6 | -31.6 | -41.1 | -24.0 | -16.6 | -23.0 | -32.0 | -44.3 | -61.5 |
| EBIT, % | -391.59 | -777.07 | -162.84 | -607.83 | -200.04 | -100 | -100 | -100 | -100 | -100 |
| Total Cash | 15.8 | 133.2 | 132.9 | 95.6 | 76.6 | 16.6 | 23.0 | 32.0 | 44.3 | 61.5 |
| Total Cash, percent | .0 | .0 | .0 | .0 | .0 | .0 | .0 | .0 | .0 | .0 |
| Account Receivables | 1.1 | .7 | 3.3 | 1.7 | .0 | 2.9 | 4.0 | 5.5 | 7.6 | 10.6 |
| Account Receivables, % | 30.42 | 13.72 | 16.78 | 25.1 | 0 | 17.2 | 17.2 | 17.2 | 17.2 | 17.2 |
| Inventories | .0 | .0 | .0 | .0 | .0 | .0 | .0 | .0 | .0 | .0 |
| Inventories, % | 0 | 0 | 0 | 0 | 0 | 0 | 0 | 0 | 0 | 0 |
| Accounts Payable | .9 | 2.6 | 4.0 | 4.4 | 2.7 | 6.0 | 8.4 | 11.6 | 16.1 | 22.3 |
| Accounts Payable, % | 24.93 | 47.72 | 20.45 | 65.68 | 22.72 | 36.3 | 36.3 | 36.3 | 36.3 | 36.3 |
| Capital Expenditure | -.5 | -.9 | -.6 | -.7 | .0 | -1.4 | -2.0 | -2.8 | -3.9 | -5.4 |
| Capital Expenditure, % | -13.4 | -16.19 | -3.03 | -10.8 | -0.19195 | -8.72 | -8.72 | -8.72 | -8.72 | -8.72 |
| Tax Rate, % | -2.57 | -2.57 | -2.57 | -2.57 | -2.57 | -2.57 | -2.57 | -2.57 | -2.57 | -2.57 |
| EBITAT | -14.7 | -41.7 | -31.8 | -41.4 | -24.6 | -16.6 | -23.0 | -32.0 | -44.3 | -61.5 |
| Depreciation | ||||||||||
| Changes in Account Receivables | ||||||||||
| Changes in Inventories | ||||||||||
| Changes in Accounts Payable | ||||||||||
| Capital Expenditure | ||||||||||
| UFCF | -15.2 | -40.0 | -32.7 | -39.5 | -24.2 | -16.5 | -22.3 | -30.9 | -42.9 | -59.5 |
| WACC, % | 6.48 | 6.48 | 6.48 | 6.48 | 6.48 | 6.48 | 6.48 | 6.48 | 6.48 | 6.48 |
| PV UFCF | ||||||||||
| SUM PV UFCF | -137.6 | |||||||||
| Long Term Growth Rate, % | 2.00 | |||||||||
| Free cash flow (T + 1) | -61 | |||||||||
| Terminal Value | -1,353 | |||||||||
| Present Terminal Value | -988 | |||||||||
| Enterprise Value | -1,125 | |||||||||
| Net Debt | -30 | |||||||||
| Equity Value | -1,096 | |||||||||
| Diluted Shares Outstanding, MM | 27 | |||||||||
| Equity Value Per Share | -40.83 |
What You Will Get
- Real LAVA Data: Preloaded financials – from revenue to EBIT – based on actual and projected figures for LAVA Therapeutics N.V. (LVTX).
- Full Customization: Adjust all critical parameters (yellow cells) like WACC, growth %, and tax rates to suit your analysis.
- Instant Valuation Updates: Automatic recalculations to analyze the impact of changes on LAVA’s fair value.
- Versatile Excel Template: Tailored for quick edits, scenario testing, and detailed projections specific to LAVA Therapeutics N.V. (LVTX).
- Time-Saving and Accurate: Skip building models from scratch while ensuring precision and flexibility in your assessments.
Key Features
- Customizable Research Parameters: Adjust essential inputs such as clinical trial success rates, market penetration, and R&D expenditures.
- Instant Valuation Metrics: Computes intrinsic value, net present value (NPV), and other key financial metrics in real-time.
- Industry-Leading Precision: Leverages LAVA Therapeutics’ actual financial data for accurate valuation results.
- Effortless Scenario Testing: Evaluate various assumptions and analyze different outcomes with ease.
- Efficiency Booster: Streamline your analysis process without the need to create intricate valuation models from the ground up.
How It Works
- Download: Obtain the pre-built Excel file containing LAVA Therapeutics N.V. (LVTX) financial data.
- Customize: Modify projections, such as revenue growth, EBITDA %, and WACC as needed.
- Update Automatically: The intrinsic value and NPV calculations refresh in real-time.
- Test Scenarios: Develop various forecasts and assess outcomes immediately.
- Make Decisions: Leverage the valuation findings to inform your investment approach.
Why Choose This Calculator for LAVA Therapeutics (LVTX)?
- Accuracy: Utilizes real LAVA Therapeutics financial data to ensure precise calculations.
- Flexibility: Allows users to easily test and adjust inputs as needed.
- Time-Saving: Eliminates the need to create a DCF model from the ground up.
- Professional-Grade: Crafted with the expertise and detail expected by CFOs.
- User-Friendly: Intuitive design makes it accessible for users with varying levels of financial modeling experience.
Who Should Use This Product?
- Investors: Accurately assess LAVA Therapeutics N.V.'s (LVTX) fair value prior to making investment choices.
- CFOs: Utilize a high-quality DCF model for financial reporting and strategic analysis.
- Consultants: Easily customize the template for client valuation reports.
- Entrepreneurs: Acquire insights into the financial modeling practices of leading biotech firms.
- Educators: Employ it as a teaching resource to illustrate valuation techniques.
What the LAVA Template Contains
- Preloaded LVTX Data: Historical and projected financial data, including revenue, EBIT, and capital expenditures.
- DCF and WACC Models: Professional-grade sheets for calculating intrinsic value and Weighted Average Cost of Capital.
- Editable Inputs: Yellow-highlighted cells for adjusting revenue growth, tax rates, and discount rates.
- Financial Statements: Comprehensive annual and quarterly financials for deeper analysis.
- Key Ratios: Profitability, leverage, and efficiency ratios to evaluate performance.
- Dashboard and Charts: Visual summaries of valuation outcomes and assumptions.
Disclaimer
All information, articles, and product details provided on this website are for general informational and educational purposes only. We do not claim any ownership over, nor do we intend to infringe upon, any trademarks, copyrights, logos, brand names, or other intellectual property mentioned or depicted on this site. Such intellectual property remains the property of its respective owners, and any references here are made solely for identification or informational purposes, without implying any affiliation, endorsement, or partnership.
We make no representations or warranties, express or implied, regarding the accuracy, completeness, or suitability of any content or products presented. Nothing on this website should be construed as legal, tax, investment, financial, medical, or other professional advice. In addition, no part of this site—including articles or product references—constitutes a solicitation, recommendation, endorsement, advertisement, or offer to buy or sell any securities, franchises, or other financial instruments, particularly in jurisdictions where such activity would be unlawful.
All content is of a general nature and may not address the specific circumstances of any individual or entity. It is not a substitute for professional advice or services. Any actions you take based on the information provided here are strictly at your own risk. You accept full responsibility for any decisions or outcomes arising from your use of this website and agree to release us from any liability in connection with your use of, or reliance upon, the content or products found herein.