
|
Max Estates Limited (Maxestates.NS) Évaluation DCF |
Entièrement Modifiable: Adapté À Vos Besoins Dans Excel Ou Sheets
Conception Professionnelle: Modèles Fiables Et Conformes Aux Normes Du Secteur
Pré-Construits Pour Une Utilisation Rapide Et Efficace
Compatible MAC/PC, entièrement débloqué
Aucune Expertise N'Est Requise; Facile À Suivre
Max Estates Limited (MAXESTATES.NS) Bundle
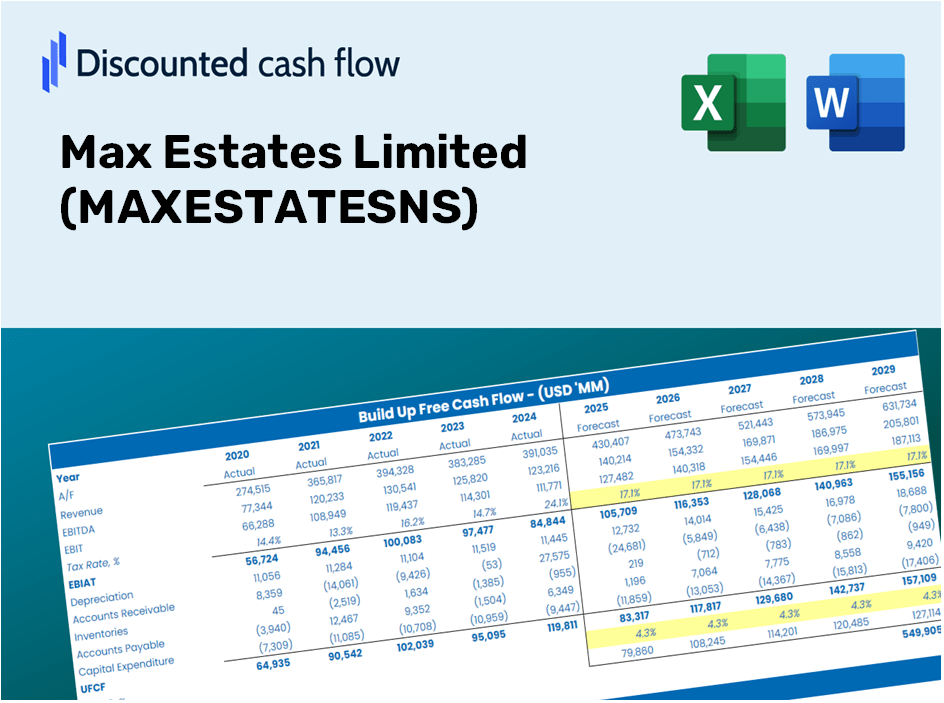
Gagnez de la maîtrise sur votre analyse d'évaluation Max Estates Limited (MaxestatesSNS) à l'aide de notre calculatrice sophistiquée DCF! Équipée de données réelles (maxestates), ce modèle Excel vous permet d'ajuster les prévisions et les hypothèses pour déterminer avec précision la valeur intrinsèque de Max Estates Limited.
What You Will Receive
- Authentic MAXESTATESNS Financial Data: Access to both historical and projected figures for precise valuation.
- Customizable Parameters: Adjust variables such as WACC, tax rates, revenue growth, and capital expenditures as needed.
- Real-Time Calculations: Dynamic computation of intrinsic value and NPV.
- Comprehensive Scenario Analysis: Explore various scenarios to assess the future performance of Max Estates Limited.
- User-Friendly Interface: Designed for professionals while remaining approachable for newcomers.
Key Features
- Real-Time MAXESTATESNS Data: Comes pre-loaded with Max Estates Limited's historical performance metrics and future projections.
- Fully Customizable Inputs: Tailor your assumptions on revenue growth, profit margins, WACC, tax rates, and capital expenditures.
- Dynamic Valuation Model: Instantaneously updates Net Present Value (NPV) and intrinsic value as you modify your inputs.
- Scenario Analysis: Generate various forecasting scenarios to explore different valuation results.
- User-Friendly Interface: Intuitive and organized, catering to both seasoned professionals and newcomers.
How It Functions
- Download the Template: Gain immediate access to the Excel-based MAXESTATESNS DCF Calculator.
- Input Your Assumptions: Modify the yellow-highlighted cells to reflect growth rates, WACC, margins, and more.
- Instant Calculations: The model automatically recalculates the intrinsic value of Max Estates Limited.
- Test Scenarios: Experiment with different assumptions to explore potential changes in valuation.
- Analyze and Decide: Utilize the results to inform your investment or financial strategy.
Why Opt for the MAXESTATESNS Calculator?
- Time-Saving: Eliminate the hassle of building a DCF model from the ground up – it's ready for immediate use.
- Enhanced Accuracy: Dependable financial data and formulas minimize errors in your valuations.
- Completely Customizable: Adapt the model to align with your specific assumptions and forecasts.
- User-Friendly: Intuitive charts and outputs make it simple to interpret the results.
- Endorsed by Professionals: Crafted for experts who prioritize precision and ease of use.
Who Can Benefit from Max Estates Limited (MAXESTATESNS)?
- Real Estate Students: Master property valuation methods and apply them using real-market data.
- Researchers: Integrate advanced property models into your academic projects or studies.
- Investors: Validate your investment strategies and analyze property valuation trends for Max Estates Limited (MAXESTATESNS).
- Market Analysts: Enhance your analysis with a user-friendly, customizable real estate valuation model.
- Property Entrepreneurs: Discover how major real estate firms like Max Estates Limited (MAXESTATESNS) assess assets.
Contents of the Template
- Pre-Filled Data: Contains historical financials and projections for Max Estates Limited (MAXESTATESNS).
- Discounted Cash Flow Model: An editable DCF valuation model with automatic computation features.
- Weighted Average Cost of Capital (WACC): A specific sheet designed for WACC calculations using customized inputs.
- Key Financial Ratios: Evaluate the profitability, efficiency, and leverage of Max Estates Limited (MAXESTATESNS).
- Customizable Inputs: Easily modify revenue growth rates, profit margins, and tax assumptions.
- Clear Dashboard: Visual representations, including charts and tables, that summarize essential valuation outcomes.
Disclaimer
All information, articles, and product details provided on this website are for general informational and educational purposes only. We do not claim any ownership over, nor do we intend to infringe upon, any trademarks, copyrights, logos, brand names, or other intellectual property mentioned or depicted on this site. Such intellectual property remains the property of its respective owners, and any references here are made solely for identification or informational purposes, without implying any affiliation, endorsement, or partnership.
We make no representations or warranties, express or implied, regarding the accuracy, completeness, or suitability of any content or products presented. Nothing on this website should be construed as legal, tax, investment, financial, medical, or other professional advice. In addition, no part of this site—including articles or product references—constitutes a solicitation, recommendation, endorsement, advertisement, or offer to buy or sell any securities, franchises, or other financial instruments, particularly in jurisdictions where such activity would be unlawful.
All content is of a general nature and may not address the specific circumstances of any individual or entity. It is not a substitute for professional advice or services. Any actions you take based on the information provided here are strictly at your own risk. You accept full responsibility for any decisions or outcomes arising from your use of this website and agree to release us from any liability in connection with your use of, or reliance upon, the content or products found herein.