
|
Mustang Bio, Inc. (MBIO) Évaluation DCF |
Entièrement Modifiable: Adapté À Vos Besoins Dans Excel Ou Sheets
Conception Professionnelle: Modèles Fiables Et Conformes Aux Normes Du Secteur
Pré-Construits Pour Une Utilisation Rapide Et Efficace
Compatible MAC/PC, entièrement débloqué
Aucune Expertise N'Est Requise; Facile À Suivre
Mustang Bio, Inc. (MBIO) Bundle
Vous cherchez à évaluer la valeur intrinsèque de Mustang Bio, Inc.? Notre calculatrice MBIO DCF intègre des données réelles avec des options de personnalisation étendues, vous permettant d'ajuster les prévisions et d'améliorer vos choix d'investissement.
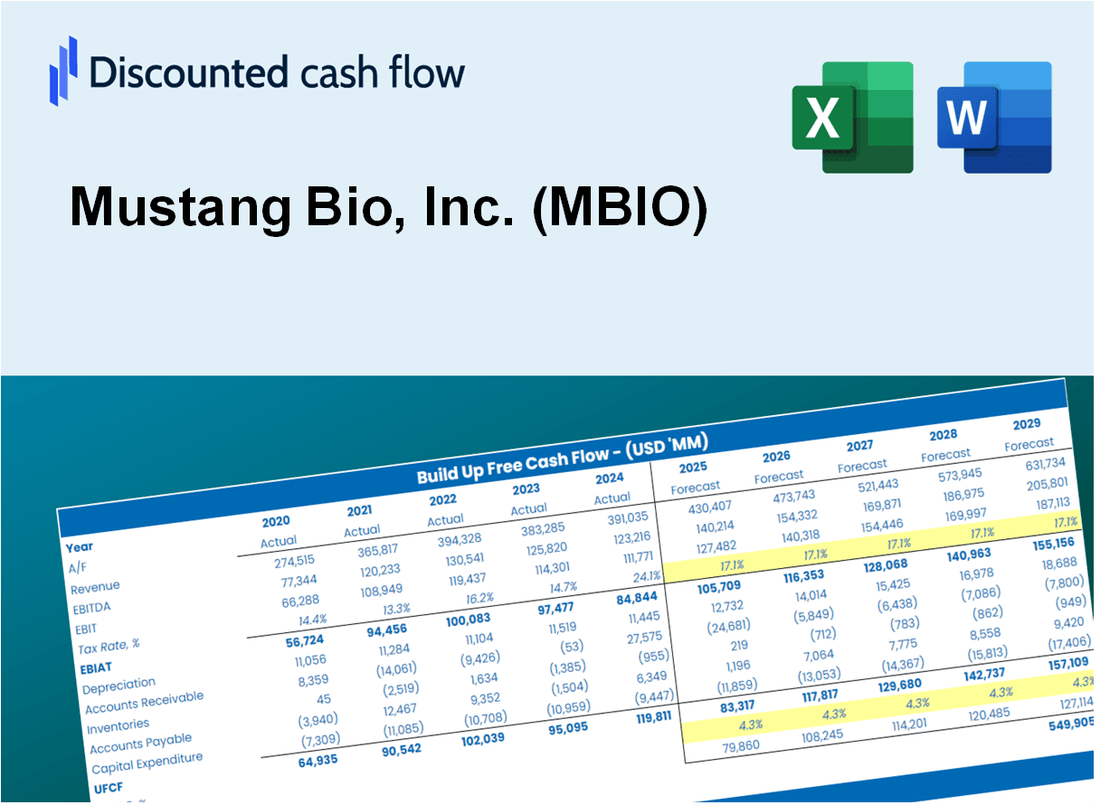
Discounted Cash Flow (DCF) - (USD MM)
| Year | AY1 2020 |
AY2 2021 |
AY3 2022 |
AY4 2023 |
AY5 2024 |
FY1 2025 |
FY2 2026 |
FY3 2027 |
FY4 2028 |
FY5 2029 |
|---|---|---|---|---|---|---|---|---|---|---|
| Revenue | .0 | .0 | .0 | .0 | .0 | .0 | .0 | .0 | .0 | .0 |
| Revenue Growth, % | 0 | 0 | 0 | 0 | 0 | 0 | 0 | 0 | 0 | 0 |
| EBITDA | -54.3 | -64.0 | -71.1 | -48.1 | -14.9 | .0 | .0 | .0 | .0 | .0 |
| EBITDA, % | 100 | 100 | 100 | 100 | 100 | 100 | 100 | 100 | 100 | 100 |
| Depreciation | 1.8 | 2.3 | 3.0 | 2.2 | .8 | .0 | .0 | .0 | .0 | .0 |
| Depreciation, % | 100 | 100 | 100 | 100 | 100 | 100 | 100 | 100 | 100 | 100 |
| EBIT | -56.1 | -66.4 | -74.2 | -50.3 | -15.7 | .0 | .0 | .0 | .0 | .0 |
| EBIT, % | 100 | 100 | 100 | 100 | 100 | 100 | 100 | 100 | 100 | 100 |
| Total Cash | 97.8 | 109.6 | 75.7 | 6.2 | 6.8 | .0 | .0 | .0 | .0 | .0 |
| Total Cash, percent | .0 | .0 | .0 | .0 | .0 | .0 | .0 | .0 | .0 | .0 |
| Account Receivables | .0 | .1 | .0 | 3.9 | .4 | .0 | .0 | .0 | .0 | .0 |
| Account Receivables, % | 100 | 100 | 100 | 100 | 100 | 100 | 100 | 100 | 100 | 100 |
| Inventories | .0 | .0 | .0 | .0 | .0 | .0 | .0 | .0 | .0 | .0 |
| Inventories, % | 100 | 100 | 100 | 100 | 100 | 100 | 100 | 100 | 100 | 100 |
| Accounts Payable | 3.5 | 3.5 | 6.8 | 6.3 | 7.5 | .0 | .0 | .0 | .0 | .0 |
| Accounts Payable, % | 100 | 100 | 100 | 100 | 100 | 100 | 100 | 100 | 100 | 100 |
| Capital Expenditure | -4.4 | -5.4 | -3.1 | -.1 | .0 | .0 | .0 | .0 | .0 | .0 |
| Capital Expenditure, % | 100 | 100 | 100 | 100 | 100 | 0 | 0 | 0 | 0 | 0 |
| Tax Rate, % | 0 | 0 | 0 | 0 | 0 | 0 | 0 | 0 | 0 | 0 |
| EBITAT | -56.1 | -66.4 | -74.2 | -50.3 | -15.7 | .0 | .0 | .0 | .0 | .0 |
| Depreciation | ||||||||||
| Changes in Account Receivables | ||||||||||
| Changes in Inventories | ||||||||||
| Changes in Accounts Payable | ||||||||||
| Capital Expenditure | ||||||||||
| UFCF | -55.2 | -69.5 | -70.8 | -52.6 | -10.3 | -7.1 | .0 | .0 | .0 | .0 |
| WACC, % | 13.45 | 13.45 | 13.45 | 13.45 | 13.45 | 13.45 | 13.45 | 13.45 | 13.45 | 13.45 |
| PV UFCF | ||||||||||
| SUM PV UFCF | -6.2 | |||||||||
| Long Term Growth Rate, % | 2.00 | |||||||||
| Free cash flow (T + 1) | 0 | |||||||||
| Terminal Value | 0 | |||||||||
| Present Terminal Value | 0 | |||||||||
| Enterprise Value | -6 | |||||||||
| Net Debt | -6 | |||||||||
| Equity Value | 0 | |||||||||
| Diluted Shares Outstanding, MM | 6 | |||||||||
| Equity Value Per Share | -0.04 |
What You Will Receive
- Pre-Filled Financial Model: Mustang Bio, Inc.'s (MBIO) actual data facilitates accurate DCF valuation.
- Complete Forecast Control: Modify revenue growth, margins, WACC, and other essential drivers.
- Real-Time Calculations: Automatic updates ensure immediate visibility of results as adjustments are made.
- Investor-Ready Template: A polished Excel file crafted for professional-level valuation.
- Customizable and Reusable: Designed for adaptability, allowing for repeated use in comprehensive forecasts.
Key Features
- 🔍 Real-Life MBIO Financials: Pre-filled historical and projected data for Mustang Bio, Inc. (MBIO).
- ✏️ Fully Customizable Inputs: Adjust all critical parameters (yellow cells) like WACC, growth %, and tax rates.
- 📊 Professional DCF Valuation: Built-in formulas calculate Mustang Bio’s intrinsic value using the Discounted Cash Flow method.
- ⚡ Instant Results: Visualize Mustang Bio’s valuation instantly after making changes.
- Scenario Analysis: Test and compare outcomes for various financial assumptions side-by-side.
How It Works
- Step 1: Download the prebuilt Excel template featuring Mustang Bio, Inc. (MBIO) data.
- Step 2: Review the pre-filled sheets to familiarize yourself with the essential metrics.
- Step 3: Modify forecasts and assumptions in the editable yellow cells (WACC, growth, margins).
- Step 4: Instantly see recalculated results, including Mustang Bio, Inc. (MBIO)'s intrinsic value.
- Step 5: Make informed investment decisions or create reports based on the outputs.
Why Choose Mustang Bio, Inc. (MBIO)?
- Innovative Solutions: Cutting-edge therapies developed to address unmet medical needs.
- Proven Expertise: A team of experienced professionals dedicated to advancing biotechnology.
- Robust Pipeline: Diverse portfolio of candidates in various stages of development.
- Commitment to Quality: Adherence to the highest standards in research and manufacturing processes.
- Positive Impact: Focused on improving patient outcomes and transforming lives.
Who Should Use This Product?
- Professional Investors: Develop comprehensive and accurate valuation models for analyzing Mustang Bio, Inc. (MBIO) investments.
- Corporate Finance Teams: Evaluate valuation scenarios to inform strategic decisions within the organization.
- Consultants and Advisors: Deliver precise valuation insights for clients interested in Mustang Bio, Inc. (MBIO).
- Students and Educators: Utilize real-world data to enhance learning and practice in financial modeling.
- Biotech Enthusiasts: Gain insights into how biotech companies like Mustang Bio, Inc. (MBIO) are valued in the marketplace.
What the Template Contains
- Historical Data: Includes Mustang Bio, Inc.'s (MBIO) past financials and baseline forecasts.
- DCF and Levered DCF Models: Detailed templates to calculate Mustang Bio, Inc.'s (MBIO) intrinsic value.
- WACC Sheet: Pre-built calculations for Weighted Average Cost of Capital.
- Editable Inputs: Modify key drivers like growth rates, EBITDA %, and CAPEX assumptions.
- Quarterly and Annual Statements: A complete breakdown of Mustang Bio, Inc.'s (MBIO) financials.
- Interactive Dashboard: Visualize valuation results and projections dynamically.
Disclaimer
All information, articles, and product details provided on this website are for general informational and educational purposes only. We do not claim any ownership over, nor do we intend to infringe upon, any trademarks, copyrights, logos, brand names, or other intellectual property mentioned or depicted on this site. Such intellectual property remains the property of its respective owners, and any references here are made solely for identification or informational purposes, without implying any affiliation, endorsement, or partnership.
We make no representations or warranties, express or implied, regarding the accuracy, completeness, or suitability of any content or products presented. Nothing on this website should be construed as legal, tax, investment, financial, medical, or other professional advice. In addition, no part of this site—including articles or product references—constitutes a solicitation, recommendation, endorsement, advertisement, or offer to buy or sell any securities, franchises, or other financial instruments, particularly in jurisdictions where such activity would be unlawful.
All content is of a general nature and may not address the specific circumstances of any individual or entity. It is not a substitute for professional advice or services. Any actions you take based on the information provided here are strictly at your own risk. You accept full responsibility for any decisions or outcomes arising from your use of this website and agree to release us from any liability in connection with your use of, or reliance upon, the content or products found herein.