
|
Malibu Boats, Inc. (MBUU) Évaluation DCF |
Entièrement Modifiable: Adapté À Vos Besoins Dans Excel Ou Sheets
Conception Professionnelle: Modèles Fiables Et Conformes Aux Normes Du Secteur
Pré-Construits Pour Une Utilisation Rapide Et Efficace
Compatible MAC/PC, entièrement débloqué
Aucune Expertise N'Est Requise; Facile À Suivre
Malibu Boats, Inc. (MBUU) Bundle
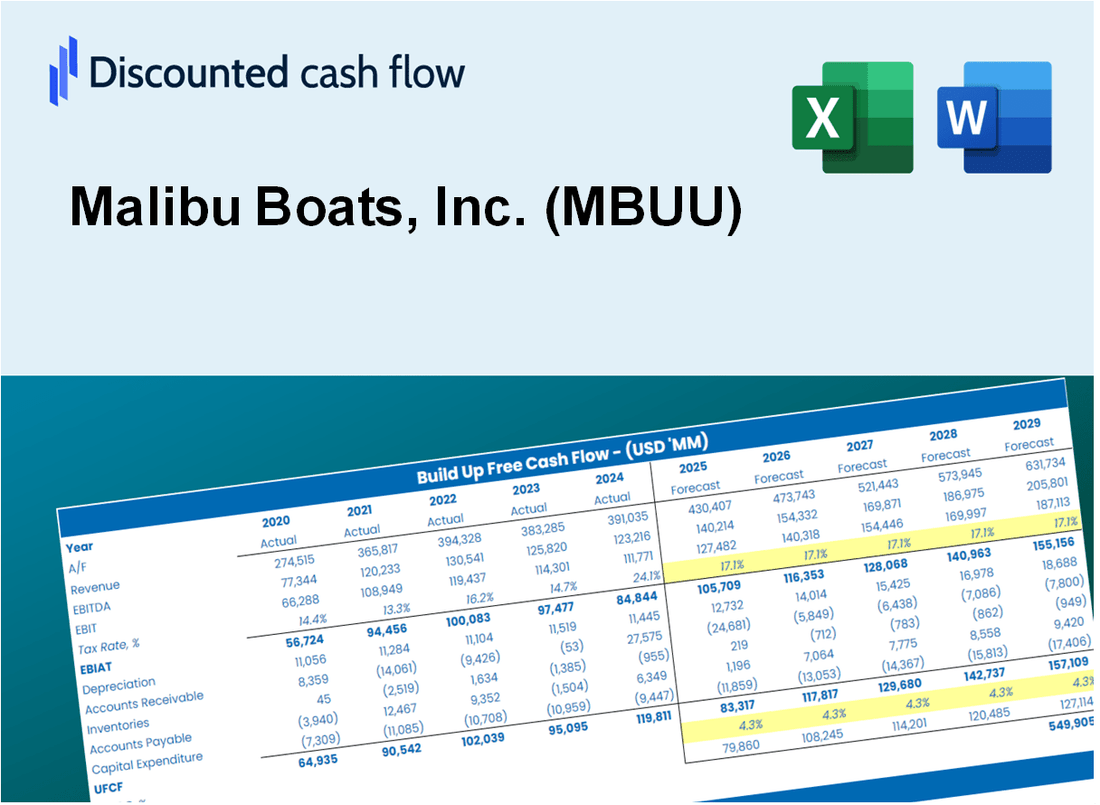
Gardez un aperçu de l'analyse de l'évaluation de votre Malibu Boats, Inc. (MBUU) à l'aide de notre calculatrice DCF de pointe! Ce modèle Excel est préchargé avec des données MBUU authentiques, vous permettant d'ajuster les prévisions et les hypothèses pour déterminer la valeur intrinsèque de Malibu Boats, Inc. avec précision.
Discounted Cash Flow (DCF) - (USD MM)
| Year | AY1 2021 |
AY2 2022 |
AY3 2023 |
AY4 2024 |
AY5 2025 |
FY1 2026 |
FY2 2027 |
FY3 2028 |
FY4 2029 |
FY5 2030 |
|---|---|---|---|---|---|---|---|---|---|---|
| Revenue | 926.5 | 1,214.9 | 1,388.4 | 829.0 | 807.6 | 859.7 | 915.2 | 974.3 | 1,037.2 | 1,104.2 |
| Revenue Growth, % | 0 | 31.12 | 14.28 | -40.29 | -2.59 | 6.46 | 6.46 | 6.46 | 6.46 | 6.46 |
| EBITDA | 183.6 | 240.1 | 278.3 | -23.0 | 60.7 | 110.7 | 117.8 | 125.4 | 133.5 | 142.2 |
| EBITDA, % | 19.82 | 19.77 | 20.04 | -2.77 | 7.52 | 12.88 | 12.88 | 12.88 | 12.88 | 12.88 |
| Depreciation | 22.9 | 26.3 | 28.7 | 33.0 | 38.6 | 26.6 | 28.3 | 30.1 | 32.1 | 34.1 |
| Depreciation, % | 2.47 | 2.17 | 2.07 | 3.98 | 4.78 | 3.09 | 3.09 | 3.09 | 3.09 | 3.09 |
| EBIT | 160.7 | 213.8 | 249.6 | -55.9 | 22.1 | 84.1 | 89.5 | 95.3 | 101.5 | 108.0 |
| EBIT, % | 17.34 | 17.6 | 17.98 | -6.75 | 2.74 | 9.78 | 9.78 | 9.78 | 9.78 | 9.78 |
| Total Cash | 41.5 | 83.7 | 78.9 | 26.9 | 37.0 | 42.8 | 45.6 | 48.5 | 51.6 | 55.0 |
| Total Cash, percent | .0 | .0 | .0 | .0 | .0 | .0 | .0 | .0 | .0 | .0 |
| Account Receivables | 49.8 | 51.6 | 68.4 | 23.1 | 33.4 | 36.9 | 39.3 | 41.9 | 44.6 | 47.4 |
| Account Receivables, % | 5.38 | 4.25 | 4.93 | 2.79 | 4.14 | 4.3 | 4.3 | 4.3 | 4.3 | 4.3 |
| Inventories | 116.7 | 157.0 | 171.2 | 145.6 | 142.2 | 125.5 | 133.6 | 142.3 | 151.5 | 161.2 |
| Inventories, % | 12.59 | 12.92 | 12.33 | 17.56 | 17.6 | 14.6 | 14.6 | 14.6 | 14.6 | 14.6 |
| Accounts Payable | 46.0 | 44.4 | 40.4 | 19.2 | 24.4 | 29.0 | 30.9 | 32.9 | 35.0 | 37.2 |
| Accounts Payable, % | 4.96 | 3.65 | 2.91 | 2.31 | 3.02 | 3.37 | 3.37 | 3.37 | 3.37 | 3.37 |
| Capital Expenditure | -30.7 | -55.1 | -54.8 | -76.0 | -27.9 | -42.0 | -44.7 | -47.6 | -50.6 | -53.9 |
| Capital Expenditure, % | -3.31 | -4.53 | -3.95 | -9.16 | -3.46 | -4.88 | -4.88 | -4.88 | -4.88 | -4.88 |
| Tax Rate, % | 26.57 | 26.57 | 26.57 | 26.57 | 26.57 | 26.57 | 26.57 | 26.57 | 26.57 | 26.57 |
| EBITAT | 119.1 | 160.5 | 184.3 | -54.1 | 16.3 | 66.1 | 70.4 | 75.0 | 79.8 | 85.0 |
| Depreciation | ||||||||||
| Changes in Account Receivables | ||||||||||
| Changes in Inventories | ||||||||||
| Changes in Accounts Payable | ||||||||||
| Capital Expenditure | ||||||||||
| UFCF | -9.3 | 88.1 | 123.3 | -47.5 | 25.3 | 68.4 | 45.4 | 48.3 | 51.5 | 54.8 |
| WACC, % | 9.25 | 9.25 | 9.25 | 9.33 | 9.25 | 9.26 | 9.26 | 9.26 | 9.26 | 9.26 |
| PV UFCF | ||||||||||
| SUM PV UFCF | 209.0 | |||||||||
| Long Term Growth Rate, % | 0.50 | |||||||||
| Free cash flow (T + 1) | 55 | |||||||||
| Terminal Value | 628 | |||||||||
| Present Terminal Value | 403 | |||||||||
| Enterprise Value | 612 | |||||||||
| Net Debt | -12 | |||||||||
| Equity Value | 624 | |||||||||
| Diluted Shares Outstanding, MM | 20 | |||||||||
| Equity Value Per Share | 31.69 |
What You Will Get
- Real Malibu Data: Preloaded financials – from revenue to EBIT – based on actual and projected figures for Malibu Boats, Inc. (MBUU).
- Full Customization: Adjust all critical parameters (yellow cells) like WACC, growth %, and tax rates to fit your analysis needs.
- Instant Valuation Updates: Automatic recalculations to assess the impact of changes on Malibu's fair value.
- Versatile Excel Template: Designed for quick edits, scenario testing, and comprehensive projections.
- Time-Saving and Accurate: Eliminate the hassle of building models from scratch while ensuring precision and adaptability.
Key Features
- Authentic Malibu Financials: Gain access to precise pre-loaded historical data and future forecasts.
- Adjustable Forecast Parameters: Modify highlighted cells for WACC, growth rates, and profit margins.
- Real-Time Calculations: Automatic updates for DCF, Net Present Value (NPV), and cash flow assessments.
- Interactive Dashboard: User-friendly charts and summaries to help visualize your valuation outcomes.
- Designed for All Levels: A straightforward, intuitive layout suitable for investors, CFOs, and consultants alike.
How It Works
- Step 1: Download the Excel file.
- Step 2: Review Malibu Boats, Inc.'s (MBUU) pre-filled financial data and forecasts.
- Step 3: Modify key inputs such as revenue growth, WACC, and tax rates (highlighted cells).
- Step 4: Observe the DCF model update in real-time as you adjust your assumptions.
- Step 5: Analyze the results and leverage them for your investment decisions.
Why Choose This Calculator for Malibu Boats, Inc. (MBUU)?
- Accuracy: Utilizes real Malibu Boats financial data for precise calculations.
- Flexibility: Allows users to easily test and adjust inputs as needed.
- Time-Saving: Avoid the complexity of creating a DCF model from the ground up.
- Professional-Grade: Crafted with the expertise and precision expected by CFOs.
- User-Friendly: Intuitive interface, suitable for users with varying levels of financial knowledge.
Who Should Use This Product?
- Individual Investors: Make informed decisions about buying or selling Malibu Boats, Inc. (MBUU) stock.
- Financial Analysts: Streamline valuation processes with ready-to-use financial models for Malibu Boats, Inc. (MBUU).
- Consultants: Deliver professional valuation insights on Malibu Boats, Inc. (MBUU) to clients quickly and accurately.
- Business Owners: Understand how companies like Malibu Boats, Inc. (MBUU) are valued to guide your own strategy.
- Finance Students: Learn valuation techniques using real-world data and scenarios related to Malibu Boats, Inc. (MBUU).
What the Template Contains
- Preloaded MBUU Data: Historical and projected financial data, including revenue, EBIT, and capital expenditures.
- DCF and WACC Models: Professional-grade sheets for calculating intrinsic value and Weighted Average Cost of Capital.
- Editable Inputs: Yellow-highlighted cells for adjusting revenue growth, tax rates, and discount rates.
- Financial Statements: Comprehensive annual and quarterly financials for deeper analysis.
- Key Ratios: Profitability, leverage, and efficiency ratios to evaluate performance.
- Dashboard and Charts: Visual summaries of valuation outcomes and assumptions.
Disclaimer
All information, articles, and product details provided on this website are for general informational and educational purposes only. We do not claim any ownership over, nor do we intend to infringe upon, any trademarks, copyrights, logos, brand names, or other intellectual property mentioned or depicted on this site. Such intellectual property remains the property of its respective owners, and any references here are made solely for identification or informational purposes, without implying any affiliation, endorsement, or partnership.
We make no representations or warranties, express or implied, regarding the accuracy, completeness, or suitability of any content or products presented. Nothing on this website should be construed as legal, tax, investment, financial, medical, or other professional advice. In addition, no part of this site—including articles or product references—constitutes a solicitation, recommendation, endorsement, advertisement, or offer to buy or sell any securities, franchises, or other financial instruments, particularly in jurisdictions where such activity would be unlawful.
All content is of a general nature and may not address the specific circumstances of any individual or entity. It is not a substitute for professional advice or services. Any actions you take based on the information provided here are strictly at your own risk. You accept full responsibility for any decisions or outcomes arising from your use of this website and agree to release us from any liability in connection with your use of, or reliance upon, the content or products found herein.