
|
Seres Therapeutics, Inc. (MCRB) Valation DCF |
Entièrement Modifiable: Adapté À Vos Besoins Dans Excel Ou Sheets
Conception Professionnelle: Modèles Fiables Et Conformes Aux Normes Du Secteur
Pré-Construits Pour Une Utilisation Rapide Et Efficace
Compatible MAC/PC, entièrement débloqué
Aucune Expertise N'Est Requise; Facile À Suivre
Seres Therapeutics, Inc. (MCRB) Bundle
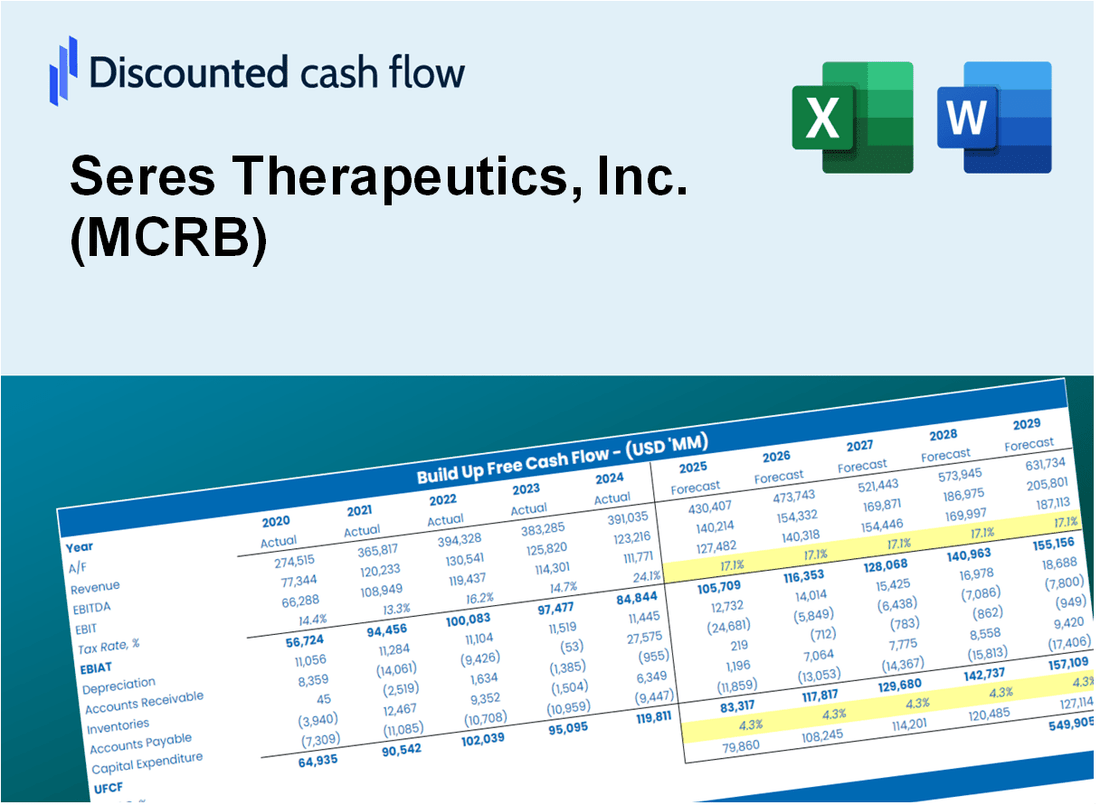
Simplifier Seres Therapeutics, Inc. (MCRB) Valation avec cette calculatrice DCF personnalisable! Doté de Real Seres Therapeutics, Inc. (MCRB) Financials and Rajustement des intrants de prévision, vous pouvez tester les scénarios et découvrir Seres Therapeutics, Inc. (MCRB) la juste valeur en minutes.
What You Will Get
- Editable Forecast Inputs: Easily modify assumptions (growth %, margins, WACC) to generate various scenarios.
- Real-World Data: Seres Therapeutics, Inc. (MCRB) financial data pre-filled to kickstart your analysis.
- Automatic DCF Outputs: The template computes Net Present Value (NPV) and intrinsic value automatically.
- Customizable and Professional: A refined Excel model tailored to your valuation requirements.
- Built for Analysts and Investors: Perfect for evaluating projections, confirming strategies, and enhancing efficiency.
Key Features
- 🔍 Real-Life MCRB Financials: Pre-filled historical and projected data for Seres Therapeutics, Inc.
- ✏️ Fully Customizable Inputs: Adjust all critical parameters (yellow cells) like WACC, growth %, and tax rates.
- 📊 Professional DCF Valuation: Built-in formulas calculate Seres Therapeutics' intrinsic value using the Discounted Cash Flow method.
- ⚡ Instant Results: Visualize Seres Therapeutics' valuation instantly after making changes.
- Scenario Analysis: Test and compare outcomes for various financial assumptions side-by-side.
How It Works
- 1. Access the Template: Download and open the Excel file containing Seres Therapeutics, Inc.'s (MCRB) preloaded data.
- 2. Modify Assumptions: Adjust key inputs such as growth rates, WACC, and capital expenditures to fit your analysis.
- 3. Analyze Results Immediately: The DCF model automatically computes intrinsic value and NPV based on your inputs.
- 4. Explore Different Scenarios: Evaluate various forecasts to understand the impact on valuation outcomes.
- 5. Present with Assurance: Deliver professional valuation insights to bolster your decision-making process.
Why Choose This Calculator for Seres Therapeutics, Inc. (MCRB)?
- Accuracy: Utilizes real Seres Therapeutics financial data for precise calculations.
- Flexibility: Allows users to easily test and adjust inputs to fit their needs.
- Time-Saving: Eliminate the complexities of creating a DCF model from the ground up.
- Professional-Grade: Crafted with the expertise and usability expected by top financial professionals.
- User-Friendly: Intuitive design makes it accessible for users with varying levels of financial modeling knowledge.
Who Should Use This Product?
- Individual Investors: Gain insights for making informed decisions about investing in Seres Therapeutics, Inc. (MCRB).
- Financial Analysts: Enhance valuation methodologies with comprehensive financial models tailored for Seres Therapeutics, Inc. (MCRB).
- Consultants: Provide clients with expert valuation analysis related to Seres Therapeutics, Inc. (MCRB) efficiently and effectively.
- Business Owners: Learn from the valuation strategies of biotech companies like Seres Therapeutics, Inc. (MCRB) to inform your own business approaches.
- Finance Students: Explore real-world valuation techniques through case studies involving Seres Therapeutics, Inc. (MCRB).
What the Template Contains
- Preloaded MCRB Data: Historical and projected financial data, including revenue, EBIT, and capital expenditures.
- DCF and WACC Models: Professional-grade sheets for calculating intrinsic value and Weighted Average Cost of Capital.
- Editable Inputs: Yellow-highlighted cells for adjusting revenue growth, tax rates, and discount rates.
- Financial Statements: Comprehensive annual and quarterly financials for deeper analysis.
- Key Ratios: Profitability, leverage, and efficiency ratios to evaluate performance.
- Dashboard and Charts: Visual summaries of valuation outcomes and assumptions.
Disclaimer
All information, articles, and product details provided on this website are for general informational and educational purposes only. We do not claim any ownership over, nor do we intend to infringe upon, any trademarks, copyrights, logos, brand names, or other intellectual property mentioned or depicted on this site. Such intellectual property remains the property of its respective owners, and any references here are made solely for identification or informational purposes, without implying any affiliation, endorsement, or partnership.
We make no representations or warranties, express or implied, regarding the accuracy, completeness, or suitability of any content or products presented. Nothing on this website should be construed as legal, tax, investment, financial, medical, or other professional advice. In addition, no part of this site—including articles or product references—constitutes a solicitation, recommendation, endorsement, advertisement, or offer to buy or sell any securities, franchises, or other financial instruments, particularly in jurisdictions where such activity would be unlawful.
All content is of a general nature and may not address the specific circumstances of any individual or entity. It is not a substitute for professional advice or services. Any actions you take based on the information provided here are strictly at your own risk. You accept full responsibility for any decisions or outcomes arising from your use of this website and agree to release us from any liability in connection with your use of, or reliance upon, the content or products found herein.