
|
Marks and Spencer Group Plc (MKS.L) Évaluation DCF |
Entièrement Modifiable: Adapté À Vos Besoins Dans Excel Ou Sheets
Conception Professionnelle: Modèles Fiables Et Conformes Aux Normes Du Secteur
Pré-Construits Pour Une Utilisation Rapide Et Efficace
Compatible MAC/PC, entièrement débloqué
Aucune Expertise N'Est Requise; Facile À Suivre
Marks and Spencer Group plc (MKS.L) Bundle
Améliorez vos stratégies d'investissement avec la calculatrice DCF Marks and Spencer Group PLC (MKSL)! Explorez des données financières précises, ajustez les projections et les dépenses de croissance et observez instantanément comment ces modifications affectent la valeur intrinsèque de Marks and Spencer Group plc (MKSL).
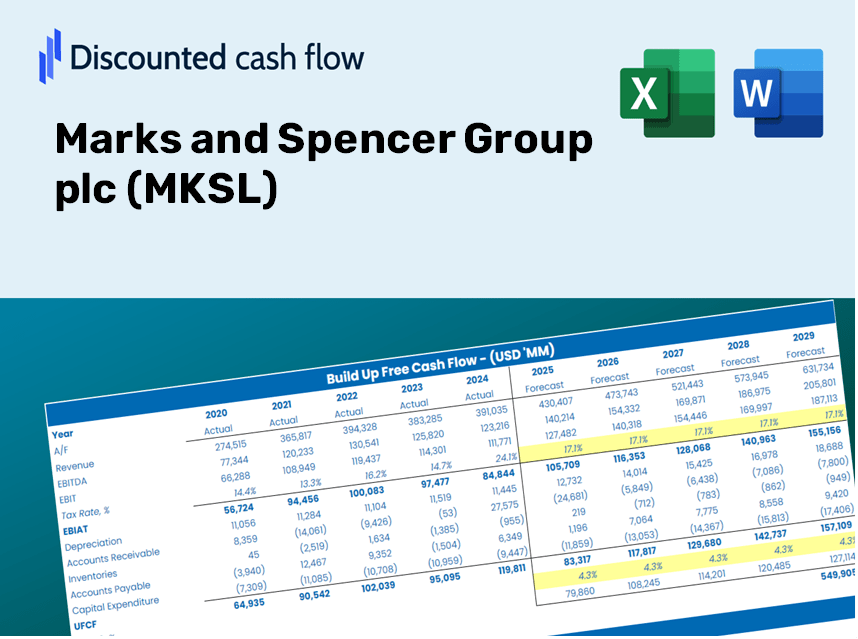
Discounted Cash Flow (DCF) - (USD MM)
| Year | AY1 2021 |
AY2 2022 |
AY3 2023 |
AY4 2024 |
AY5 2025 |
FY1 2026 |
FY2 2027 |
FY3 2028 |
FY4 2029 |
FY5 2030 |
|---|---|---|---|---|---|---|---|---|---|---|
| Revenue | 9,155.7 | 10,885.1 | 11,931.3 | 13,040.1 | 13,816.8 | 15,328.0 | 17,004.5 | 18,864.3 | 20,927.6 | 23,216.5 |
| Revenue Growth, % | 0 | 18.89 | 9.61 | 9.29 | 5.96 | 10.94 | 10.94 | 10.94 | 10.94 | 10.94 |
| EBITDA | 622.9 | 1,157.2 | 1,195.2 | 1,372.7 | 1,489.5 | 1,494.8 | 1,658.2 | 1,839.6 | 2,040.8 | 2,264.0 |
| EBITDA, % | 6.8 | 10.63 | 10.02 | 10.53 | 10.78 | 9.75 | 9.75 | 9.75 | 9.75 | 9.75 |
| Depreciation | 596.8 | 551.9 | 578.4 | 526.3 | 812.7 | 807.9 | 896.3 | 994.3 | 1,103.1 | 1,223.7 |
| Depreciation, % | 6.52 | 5.07 | 4.85 | 4.04 | 5.88 | 5.27 | 5.27 | 5.27 | 5.27 | 5.27 |
| EBIT | 26.1 | 605.3 | 616.8 | 846.4 | 676.8 | 686.8 | 762.0 | 845.3 | 937.7 | 1,040.3 |
| EBIT, % | 0.28507 | 5.56 | 5.17 | 6.49 | 4.9 | 4.48 | 4.48 | 4.48 | 4.48 | 4.48 |
| Total Cash | 692.8 | 1,215.5 | 1,080.9 | 1,030.0 | 1,148.7 | 1,349.0 | 1,496.6 | 1,660.3 | 1,841.9 | 2,043.3 |
| Total Cash, percent | .0 | .0 | .0 | .0 | .0 | .0 | .0 | .0 | .0 | .0 |
| Account Receivables | 155.7 | 139.5 | 182.7 | 192.0 | 200.0 | 227.9 | 252.8 | 280.4 | 311.1 | 345.2 |
| Account Receivables, % | 1.7 | 1.28 | 1.53 | 1.47 | 1.45 | 1.49 | 1.49 | 1.49 | 1.49 | 1.49 |
| Inventories | 624.6 | 706.1 | 764.4 | 776.9 | 843.9 | 974.3 | 1,080.8 | 1,199.1 | 1,330.2 | 1,475.7 |
| Inventories, % | 6.82 | 6.49 | 6.41 | 5.96 | 6.11 | 6.36 | 6.36 | 6.36 | 6.36 | 6.36 |
| Accounts Payable | 624.8 | 732.8 | 801.7 | 762.3 | 796.3 | 977.5 | 1,084.4 | 1,203.0 | 1,334.5 | 1,480.5 |
| Accounts Payable, % | 6.82 | 6.73 | 6.72 | 5.85 | 5.76 | 6.38 | 6.38 | 6.38 | 6.38 | 6.38 |
| Capital Expenditure | -206.7 | -257.4 | -410.3 | -429.3 | -506.9 | -460.5 | -510.9 | -566.8 | -628.8 | -697.5 |
| Capital Expenditure, % | -2.26 | -2.36 | -3.44 | -3.29 | -3.67 | -3 | -3 | -3 | -3 | -3 |
| Tax Rate, % | 42.22 | 42.22 | 42.22 | 42.22 | 42.22 | 42.22 | 42.22 | 42.22 | 42.22 | 42.22 |
| EBITAT | 24.7 | 473.8 | 471.2 | 542.7 | 391.0 | 509.8 | 565.6 | 627.4 | 696.0 | 772.2 |
| Depreciation | ||||||||||
| Changes in Account Receivables | ||||||||||
| Changes in Inventories | ||||||||||
| Changes in Accounts Payable | ||||||||||
| Capital Expenditure | ||||||||||
| UFCF | 259.3 | 811.0 | 606.7 | 578.5 | 655.8 | 880.1 | 926.4 | 1,027.7 | 1,140.1 | 1,264.8 |
| WACC, % | 7.65 | 7.39 | 7.36 | 7.16 | 7.05 | 7.32 | 7.32 | 7.32 | 7.32 | 7.32 |
| PV UFCF | ||||||||||
| SUM PV UFCF | 4,203.7 | |||||||||
| Long Term Growth Rate, % | 1.00 | |||||||||
| Free cash flow (T + 1) | 1,277 | |||||||||
| Terminal Value | 20,212 | |||||||||
| Present Terminal Value | 14,197 | |||||||||
| Enterprise Value | 18,401 | |||||||||
| Net Debt | 2,080 | |||||||||
| Equity Value | 16,321 | |||||||||
| Diluted Shares Outstanding, MM | 2,111 | |||||||||
| Equity Value Per Share | 773.26 |
What You Will Receive
- Authentic Marks and Spencer Data: Comprehensive financials – from revenue to EBIT – derived from actual and forecasted figures.
- Complete Customization: Modify all essential parameters (yellow cells) such as WACC, growth %, and tax rates.
- Immediate Valuation Updates: Automatic recalculations to assess the impact of adjustments on Marks and Spencer's fair value.
- Flexible Excel Template: Designed for easy modifications, scenario analysis, and in-depth projections.
- Efficient and Accurate: Eliminate the need to build models from the ground up while ensuring precision and adaptability.
Key Features
- Authentic Financial Data for Marks and Spencer (MKSL): Gain access to reliable pre-loaded historical figures and future financial forecasts.
- Flexible Forecasting Parameters: Modify the highlighted fields like WACC, growth rates, and profit margins easily.
- Real-Time Calculations: Enjoy automatic updates for DCF, Net Present Value (NPV), and cash flow evaluations.
- Interactive Visualization Dashboard: Utilize clear charts and summaries to effectively interpret your valuation outcomes.
- Suitable for All Skill Levels: A user-friendly design tailored for investors, CFOs, and consultants alike.
How It Functions
- Download: Get the pre-built Excel file featuring financial data for Marks and Spencer Group plc (MKSL).
- Customize: Modify forecasts such as revenue growth, EBITDA %, and WACC to fit your analysis.
- Update Automatically: Enjoy real-time updates for intrinsic value and NPV calculations.
- Test Scenarios: Generate various projections and instantly compare the results.
- Make Decisions: Leverage the valuation outcomes to inform your investment strategy.
Why Select This Calculator for Marks and Spencer Group plc (MKSL)?
- Designed for Experts: A sophisticated tool utilized by finance professionals, analysts, and advisors.
- Accurate Data: Historical and forecasted financial data for Marks and Spencer Group plc preloaded for precision.
- Versatile Scenario Analysis: Effortlessly test various forecasts and assumptions.
- Transparent Results: Instantly calculates intrinsic value, NPV, and essential metrics.
- User-Friendly: Comprehensive, step-by-step guidance to facilitate your calculations.
Who Should Benefit from This Product?
- Finance Students: Master valuation methods and apply them with real data focused on Marks and Spencer Group plc (MKSL).
- Academics: Integrate professional valuation models into your teaching or research on companies like Marks and Spencer Group plc (MKSL).
- Investors: Validate your investment hypotheses and evaluate the valuation results for Marks and Spencer Group plc (MKSL).
- Analysts: Enhance your efficiency with a pre-built, customizable DCF model tailored for Marks and Spencer Group plc (MKSL).
- Small Business Owners: Discover how large public companies such as Marks and Spencer Group plc (MKSL) are analyzed for investment insights.
Contents of the Template
- Comprehensive DCF Model: An editable template featuring in-depth valuation calculations.
- Real-World Data: Historical and projected financials for Marks and Spencer Group plc (MKSL) already included for your analysis.
- Customizable Parameters: Modify WACC, growth rates, and tax assumptions to explore various scenarios.
- Financial Statements: Detailed annual and quarterly reports for more thorough insights.
- Key Ratios: Inbuilt analysis focusing on profitability, efficiency, and leverage metrics.
- Dashboard with Visual Outputs: Clear charts and tables presenting actionable results.
Disclaimer
All information, articles, and product details provided on this website are for general informational and educational purposes only. We do not claim any ownership over, nor do we intend to infringe upon, any trademarks, copyrights, logos, brand names, or other intellectual property mentioned or depicted on this site. Such intellectual property remains the property of its respective owners, and any references here are made solely for identification or informational purposes, without implying any affiliation, endorsement, or partnership.
We make no representations or warranties, express or implied, regarding the accuracy, completeness, or suitability of any content or products presented. Nothing on this website should be construed as legal, tax, investment, financial, medical, or other professional advice. In addition, no part of this site—including articles or product references—constitutes a solicitation, recommendation, endorsement, advertisement, or offer to buy or sell any securities, franchises, or other financial instruments, particularly in jurisdictions where such activity would be unlawful.
All content is of a general nature and may not address the specific circumstances of any individual or entity. It is not a substitute for professional advice or services. Any actions you take based on the information provided here are strictly at your own risk. You accept full responsibility for any decisions or outcomes arising from your use of this website and agree to release us from any liability in connection with your use of, or reliance upon, the content or products found herein.