
|
Mueller Industries, Inc. (MLI) Évaluation DCF |
Entièrement Modifiable: Adapté À Vos Besoins Dans Excel Ou Sheets
Conception Professionnelle: Modèles Fiables Et Conformes Aux Normes Du Secteur
Pré-Construits Pour Une Utilisation Rapide Et Efficace
Compatible MAC/PC, entièrement débloqué
Aucune Expertise N'Est Requise; Facile À Suivre
Mueller Industries, Inc. (MLI) Bundle
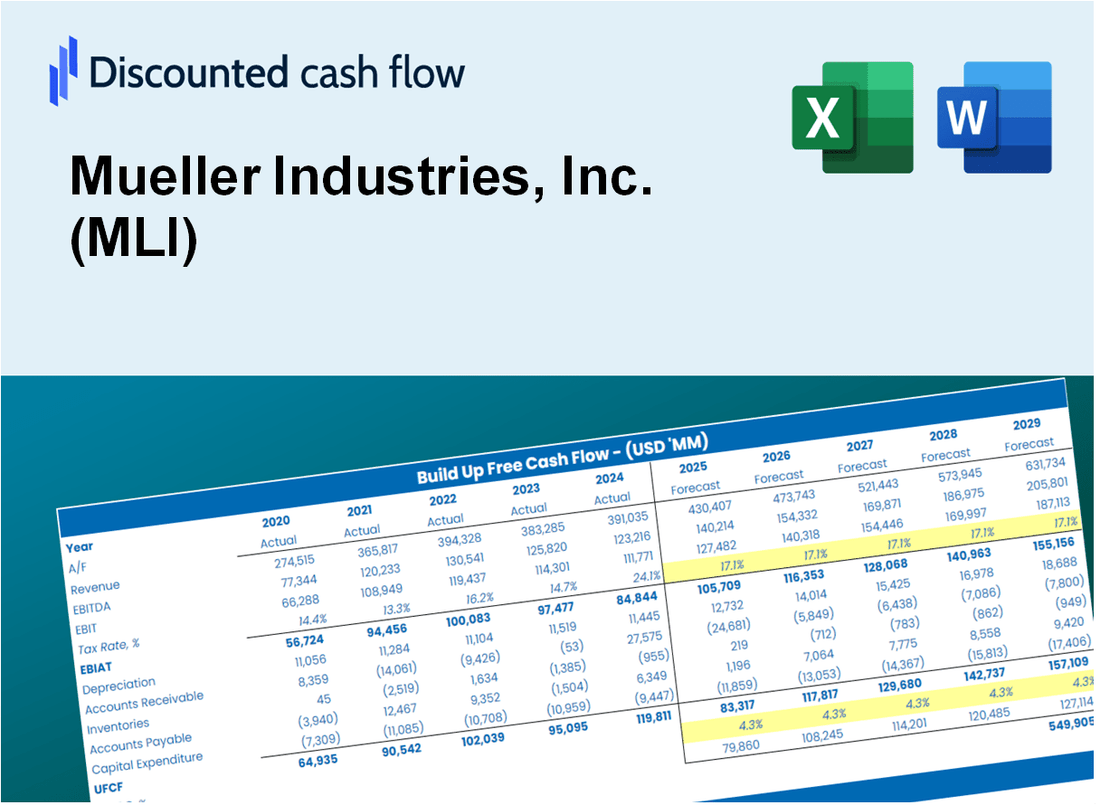
Simplifier Mueller Industries, Inc. (MLI) Valation avec cette calculatrice DCF personnalisable! Doté de Real Mueller Industries, Inc. (MLI) Financials and Adjustable Forecast Intarts, vous pouvez tester les scénarios et découvrir la juste valeur de Mueller Industries, Inc. (MLI) en minutes.
What You Will Get
- Real Mueller Data: Preloaded financials – from revenue to EBIT – based on actual and projected figures for Mueller Industries, Inc. (MLI).
- Full Customization: Adjust all critical parameters (yellow cells) like WACC, growth %, and tax rates specific to Mueller Industries, Inc. (MLI).
- Instant Valuation Updates: Automatic recalculations to analyze the impact of changes on Mueller Industries, Inc.'s (MLI) fair value.
- Versatile Excel Template: Tailored for quick edits, scenario testing, and detailed projections for Mueller Industries, Inc. (MLI).
- Time-Saving and Accurate: Skip building models from scratch while maintaining precision and flexibility for Mueller Industries, Inc. (MLI).
Key Features
- Customizable Financial Inputs: Adjust essential metrics such as sales growth, operating margin, and capital investments.
- Instant DCF Valuation: Quickly computes intrinsic value, net present value (NPV), and various financial metrics.
- High-Precision Accuracy: Leverages Mueller Industries, Inc.'s (MLI) actual financial data for dependable valuation results.
- Effortless Scenario Analysis: Easily evaluate different scenarios and analyze their impacts on outcomes.
- Efficiency Booster: Avoid the hassle of constructing intricate valuation models from the ground up.
How It Works
- Download the Template: Gain immediate access to the Excel-based MLI DCF Calculator.
- Input Your Assumptions: Modify the yellow-highlighted cells for growth rates, WACC, margins, and other variables.
- Instant Calculations: The model automatically recalculates Mueller Industries’ intrinsic value.
- Test Scenarios: Experiment with different assumptions to assess potential changes in valuation.
- Analyze and Decide: Utilize the results to inform your investment or financial strategy.
Why Choose This Calculator?
- User-Friendly Interface: Perfect for both novices and seasoned professionals.
- Customizable Inputs: Adjust parameters easily to suit your financial analysis.
- Real-Time Valuation: Observe immediate changes to Mueller Industries' valuation as you modify inputs.
- Preloaded Data: Comes with Mueller Industries' actual financial figures for swift evaluations.
- Relied Upon by Experts: Favored by investors and analysts for making well-informed choices.
Who Should Use This Product?
- Investors: Evaluate Mueller Industries, Inc.'s (MLI) performance before making investment decisions.
- CFOs and Financial Analysts: Optimize valuation methods and assess financial forecasts for Mueller Industries, Inc. (MLI).
- Startup Founders: Understand the valuation strategies of established companies like Mueller Industries, Inc. (MLI).
- Consultants: Provide detailed valuation analyses and reports for clients interested in Mueller Industries, Inc. (MLI).
- Students and Educators: Utilize real-time data from Mueller Industries, Inc. (MLI) to teach and practice valuation skills.
What the Template Contains
- Preloaded MLI Data: Historical and projected financial data, including revenue, EBIT, and capital expenditures.
- DCF and WACC Models: Professional-grade sheets for calculating intrinsic value and Weighted Average Cost of Capital.
- Editable Inputs: Yellow-highlighted cells for adjusting revenue growth, tax rates, and discount rates.
- Financial Statements: Comprehensive annual and quarterly financials for deeper analysis.
- Key Ratios: Profitability, leverage, and efficiency ratios to evaluate performance.
- Dashboard and Charts: Visual summaries of valuation outcomes and assumptions.
Disclaimer
All information, articles, and product details provided on this website are for general informational and educational purposes only. We do not claim any ownership over, nor do we intend to infringe upon, any trademarks, copyrights, logos, brand names, or other intellectual property mentioned or depicted on this site. Such intellectual property remains the property of its respective owners, and any references here are made solely for identification or informational purposes, without implying any affiliation, endorsement, or partnership.
We make no representations or warranties, express or implied, regarding the accuracy, completeness, or suitability of any content or products presented. Nothing on this website should be construed as legal, tax, investment, financial, medical, or other professional advice. In addition, no part of this site—including articles or product references—constitutes a solicitation, recommendation, endorsement, advertisement, or offer to buy or sell any securities, franchises, or other financial instruments, particularly in jurisdictions where such activity would be unlawful.
All content is of a general nature and may not address the specific circumstances of any individual or entity. It is not a substitute for professional advice or services. Any actions you take based on the information provided here are strictly at your own risk. You accept full responsibility for any decisions or outcomes arising from your use of this website and agree to release us from any liability in connection with your use of, or reliance upon, the content or products found herein.