
|
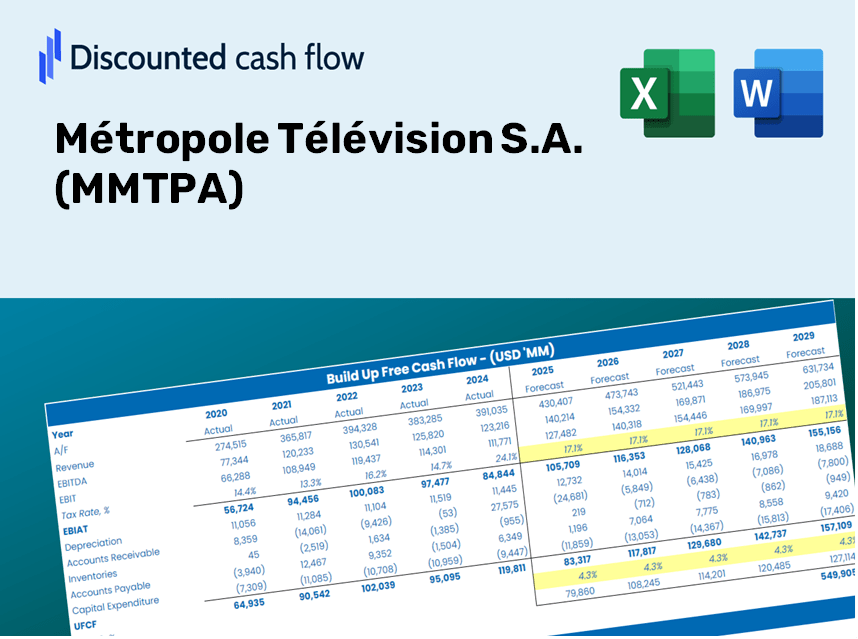
Métropole Télévision S.A. (MMT.PA) Évaluation DCF |
Entièrement Modifiable: Adapté À Vos Besoins Dans Excel Ou Sheets
Conception Professionnelle: Modèles Fiables Et Conformes Aux Normes Du Secteur
Pré-Construits Pour Une Utilisation Rapide Et Efficace
Compatible MAC/PC, entièrement débloqué
Aucune Expertise N'Est Requise; Facile À Suivre
Métropole Télévision S.A. (MMT.PA) Bundle
Explorez l'avenir financier de Métropole Télévision S.A. (MMTPA) avec notre calculatrice DCF conviviale! Entrez vos projections pour la croissance, les marges et les coûts pour calculer la valeur intrinsèque de Métropole Télévision S.A. (MMTPA) et affinez votre stratégie d'investissement.
What You Will Receive
- Authentic MMTPA Financial Data: Pre-filled with Métropole Télévision S.A.'s historical and projected figures for accurate analysis.
- Customizable Template: Effortlessly adjust key metrics such as revenue growth, WACC, and EBITDA %.
- Instant Calculations: Watch the intrinsic value of MMTPA update in real-time as you make changes.
- Professional Valuation Tool: Tailored for investors, analysts, and consultants aiming for precise DCF outcomes.
- User-Friendly Interface: Intuitive layout and straightforward instructions suitable for all experience levels.
Key Features
- 🔍 Real-Life MMTPA Financials: Pre-filled historical and projected data for Métropole Télévision S.A.
- ✏️ Fully Customizable Inputs: Adjust all essential parameters (yellow cells) such as WACC, growth %, and tax rates.
- 📊 Professional DCF Valuation: Integrated formulas compute the intrinsic value of Métropole Télévision using the Discounted Cash Flow method.
- ⚡ Instant Results: Visualize the valuation of Métropole Télévision immediately after making adjustments.
- Scenario Analysis: Evaluate and compare various financial assumptions side-by-side.
How It Works
- Step 1: Download the prebuilt Excel template featuring Métropole Télévision S.A. (MMTPA) data.
- Step 2: Review the pre-filled sheets to gain insights into essential performance metrics.
- Step 3: Modify forecasts and assumptions in the editable yellow cells (WACC, growth, margins).
- Step 4: Instantly view the updated results, including the intrinsic value of Métropole Télévision S.A. (MMTPA).
- Step 5: Use the outputs to make informed investment decisions or create detailed reports.
Why Opt for This Calculator?
- User-Friendly and Accessible: Perfectly tailored for both novices and seasoned pros.
- Customizable Inputs: Effortlessly edit parameters to suit your analysis needs.
- Immediate Feedback: Observe real-time updates to Métropole Télévision S.A.'s (MMTPA) valuation as you tweak inputs.
- Pre-Configured: Comes with Métropole Télévision S.A.'s (MMTPA) actual financial data for swift evaluations.
- Relied Upon by Experts: Favored by investors and analysts for strategic decision-making.
Who Can Benefit from This Product?
- Investors: Assess the market valuation of Métropole Télévision S.A. (MMTPA) before making trading decisions.
- CFOs and Financial Analysts: Optimize valuation processes and validate forecasts for MMTPA.
- Startup Founders: Gain insights into how leading media companies like Métropole Télévision S.A. (MMTPA) are valued.
- Consultants: Create detailed valuation reports to support your clients' financial strategies.
- Students and Educators: Utilize real-world examples to enhance learning and application of valuation methods.
Contents of the Template
- Comprehensive DCF Model: An editable template featuring detailed valuation calculations.
- Real-World Data: Historical and projected financial data for Métropole Télévision S.A. (MMTPA) preloaded for in-depth analysis.
- Customizable Parameters: Modify WACC, growth rates, and tax assumptions to explore various scenarios.
- Financial Statements: Complete annual and quarterly breakdowns for enhanced insights.
- Key Ratios: Integrated analysis covering profitability, efficiency, and leverage metrics.
- Dashboard with Visual Outputs: Clear charts and tables providing actionable results.
Disclaimer
All information, articles, and product details provided on this website are for general informational and educational purposes only. We do not claim any ownership over, nor do we intend to infringe upon, any trademarks, copyrights, logos, brand names, or other intellectual property mentioned or depicted on this site. Such intellectual property remains the property of its respective owners, and any references here are made solely for identification or informational purposes, without implying any affiliation, endorsement, or partnership.
We make no representations or warranties, express or implied, regarding the accuracy, completeness, or suitability of any content or products presented. Nothing on this website should be construed as legal, tax, investment, financial, medical, or other professional advice. In addition, no part of this site—including articles or product references—constitutes a solicitation, recommendation, endorsement, advertisement, or offer to buy or sell any securities, franchises, or other financial instruments, particularly in jurisdictions where such activity would be unlawful.
All content is of a general nature and may not address the specific circumstances of any individual or entity. It is not a substitute for professional advice or services. Any actions you take based on the information provided here are strictly at your own risk. You accept full responsibility for any decisions or outcomes arising from your use of this website and agree to release us from any liability in connection with your use of, or reliance upon, the content or products found herein.