
|
MoonPig Group plc (Moon.L) Valation DCF |
Entièrement Modifiable: Adapté À Vos Besoins Dans Excel Ou Sheets
Conception Professionnelle: Modèles Fiables Et Conformes Aux Normes Du Secteur
Pré-Construits Pour Une Utilisation Rapide Et Efficace
Compatible MAC/PC, entièrement débloqué
Aucune Expertise N'Est Requise; Facile À Suivre
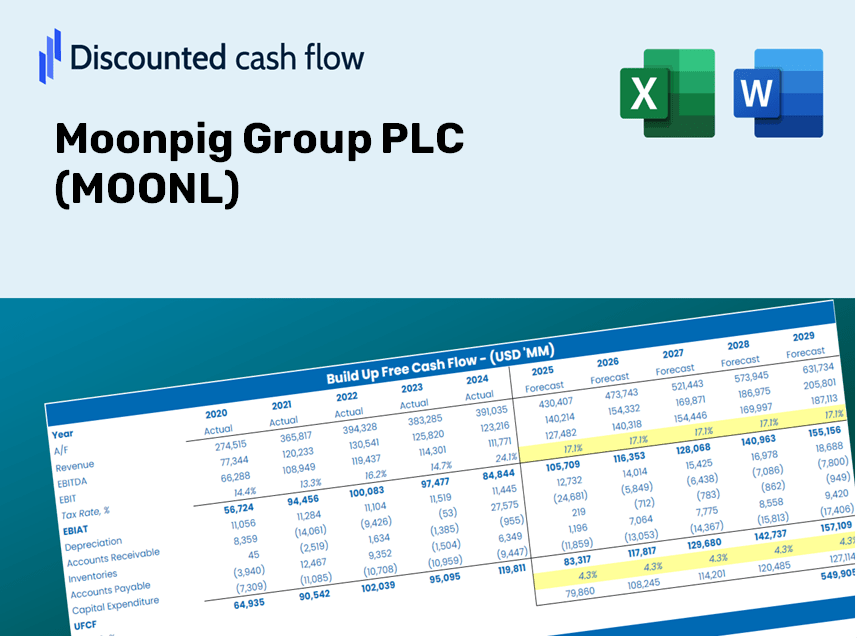
Moonpig Group PLC (MOON.L) Bundle
Explorez les perspectives financières de Moonpig Group Plc (Moonl) avec notre calculatrice DCF conviviale! Entrez vos hypothèses de croissance, de marge et de coût pour calculer la valeur intrinsèque de MoonPig Group plc (Moonl) et améliorer votre stratégie d'investissement.
What You Will Receive
- Customizable Excel Template: A fully adjustable Excel-based DCF Calculator featuring pre-filled financial data for Moonpig Group PLC (MOON).
- Accurate Data: Access to historical performance metrics and forward-looking projections (highlighted in the yellow cells).
- Flexible Forecasting: Modify key assumptions such as revenue growth, EBITDA margin, and WACC.
- Real-Time Calculations: Quickly observe how your inputs affect the valuation of Moonpig Group PLC (MOON).
- Professional Resource: Designed for investors, CFOs, consultants, and financial analysts.
- Intuitive Layout: Organized for clarity and simplicity, complete with step-by-step guidance.
Key Features
- 🔍 Real-Life MOONL Financials: Pre-filled historical and projected data for Moonpig Group PLC.
- ✏️ Fully Customizable Inputs: Adjust all key parameters (yellow cells) such as WACC, growth %, and tax rates.
- 📊 Professional DCF Valuation: Integrated formulas calculate Moonpig’s intrinsic value using the Discounted Cash Flow method.
- ⚡ Instant Results: Visualize Moonpig’s valuation immediately after making adjustments.
- Scenario Analysis: Explore and compare outcomes for different financial assumptions side-by-side.
How It Functions
- 1. Access the Template: Download and open the Excel file containing Moonpig Group PLC’s preloaded data.
- 2. Adjust Assumptions: Modify essential inputs such as growth projections, WACC, and capital expenditures.
- 3. View Instant Results: The DCF model automatically computes intrinsic value and NPV.
- 4. Explore Scenarios: Evaluate various forecasts to assess different valuation possibilities.
- 5. Present with Assurance: Share professional valuation insights to bolster your decision-making.
Why Choose the Moonpig Group PLC Calculator?
- Save Time: Skip the hassle of building a DCF model from scratch – it’s ready to go.
- Enhance Accuracy: Utilize trusted financial data and formulas to minimize valuation errors.
- Completely Customizable: Adjust the model to align with your unique assumptions and projections.
- User-Friendly: Intuitive charts and outputs simplify the analysis of your results.
- Endorsed by Professionals: Tailored for experts who prioritize both precision and ease of use.
Who Should Use Moonpig Group PLC (MOONL)?
- Finance Students: Discover valuation methods and practice with actual data.
- Academics: Utilize industry models for your courses or research projects.
- Investors: Validate your hypotheses and examine valuation scenarios for Moonpig Group PLC (MOONL).
- Analysts: Enhance your efficiency with a customizable, pre-built DCF model.
- Small Business Owners: Understand the analytical approach used for large public companies like Moonpig Group PLC (MOONL).
Contents of the Template
- Pre-Filled Financial Data: Incorporates Moonpig Group PLC's historical financials and projections.
- Discounted Cash Flow Model: An editable DCF valuation model featuring automatic calculations.
- Weighted Average Cost of Capital (WACC): A dedicated worksheet for calculating WACC using tailored inputs.
- Key Financial Ratios: Assess Moonpig Group PLC's profitability, efficiency, and leverage.
- Customizable Inputs: Easily modify revenue growth, margins, and tax rates.
- User-Friendly Dashboard: Visual representations and tables highlighting key valuation outcomes.
Disclaimer
All information, articles, and product details provided on this website are for general informational and educational purposes only. We do not claim any ownership over, nor do we intend to infringe upon, any trademarks, copyrights, logos, brand names, or other intellectual property mentioned or depicted on this site. Such intellectual property remains the property of its respective owners, and any references here are made solely for identification or informational purposes, without implying any affiliation, endorsement, or partnership.
We make no representations or warranties, express or implied, regarding the accuracy, completeness, or suitability of any content or products presented. Nothing on this website should be construed as legal, tax, investment, financial, medical, or other professional advice. In addition, no part of this site—including articles or product references—constitutes a solicitation, recommendation, endorsement, advertisement, or offer to buy or sell any securities, franchises, or other financial instruments, particularly in jurisdictions where such activity would be unlawful.
All content is of a general nature and may not address the specific circumstances of any individual or entity. It is not a substitute for professional advice or services. Any actions you take based on the information provided here are strictly at your own risk. You accept full responsibility for any decisions or outcomes arising from your use of this website and agree to release us from any liability in connection with your use of, or reliance upon, the content or products found herein.