
|
Motorcar Parts of America, Inc. (MPAA) Évaluation DCF |
Entièrement Modifiable: Adapté À Vos Besoins Dans Excel Ou Sheets
Conception Professionnelle: Modèles Fiables Et Conformes Aux Normes Du Secteur
Pré-Construits Pour Une Utilisation Rapide Et Efficace
Compatible MAC/PC, entièrement débloqué
Aucune Expertise N'Est Requise; Facile À Suivre
Motorcar Parts of America, Inc. (MPAA) Bundle
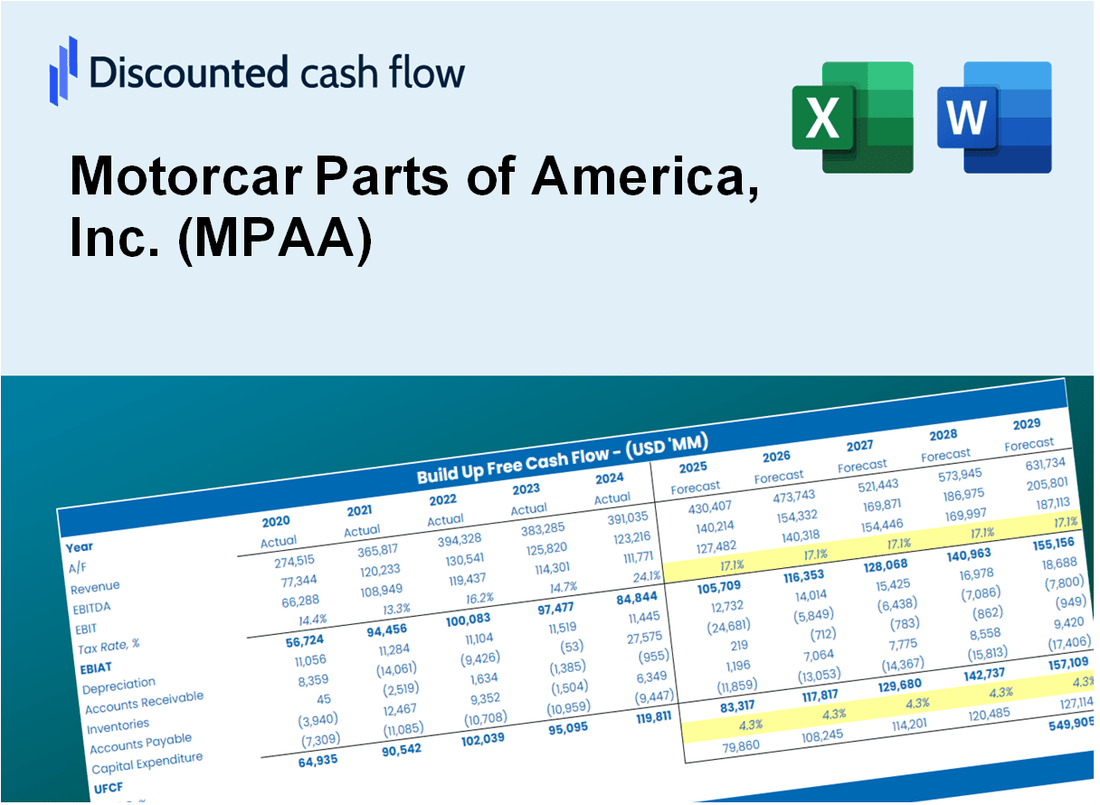
Gardez un aperçu de l'analyse de l'évaluation de vos pièces de moto d'America, Inc. (MPAA) à l'aide de notre calculatrice sophistiquée DCF! Préchargé avec les données réelles (MPAA), ce modèle Excel vous permet d'ajuster les prévisions et les hypothèses, permettant des calculs précis de la valeur intrinsèque des pièces de moto d'America, Inc.
What You Will Get
- Editable Forecast Inputs: Easily adjust key assumptions (growth %, margins, WACC) to explore various scenarios.
- Real-World Data: Motorcar Parts of America, Inc. (MPAA) financial data pre-filled to facilitate your analysis.
- Automatic DCF Outputs: The template computes Net Present Value (NPV) and intrinsic value automatically.
- Customizable and Professional: A sleek Excel model tailored to meet your valuation requirements.
- Built for Analysts and Investors: Perfect for evaluating projections, confirming strategies, and maximizing efficiency.
Key Features
- Comprehensive Historical Data: Motorcar Parts of America, Inc.’s (MPAA) detailed financial statements and projections.
- Customizable Assumptions: Modify WACC, tax rates, revenue growth, and EBITDA margins to fit your analysis.
- Real-Time Valuation: Instantly view the intrinsic value of Motorcar Parts of America, Inc. (MPAA) as it updates live.
- Intuitive Visualizations: Dashboard graphs illustrate valuation outcomes and essential metrics.
- Designed for Precision: A reliable resource for analysts, investors, and finance professionals.
How It Works
- Download: Obtain the ready-to-use Excel file featuring Motorcar Parts of America, Inc.'s (MPAA) financial data.
- Customize: Modify forecasts such as revenue growth, EBITDA %, and WACC to fit your analysis.
- Update Automatically: Watch as the intrinsic value and NPV calculations refresh in real-time.
- Test Scenarios: Generate various projections and instantly compare the results.
- Make Decisions: Leverage the valuation outcomes to inform your investment strategy.
Why Choose This Calculator for Motorcar Parts of America, Inc. (MPAA)?
- Designed for Industry Experts: A sophisticated tool utilized by automotive analysts, financial officers, and industry consultants.
- Accurate Financial Data: MPAA’s historical and projected financials are preloaded for precise analysis.
- Forecast Simulation: Effortlessly test various scenarios and assumptions.
- Comprehensive Outputs: Instantly calculates intrinsic value, NPV, and essential performance metrics.
- User-Friendly: Step-by-step guidance ensures a smooth user experience.
Who Should Use This Product?
- Investors: Assess the fair value of Motorcar Parts of America, Inc. (MPAA) before making investment choices.
- CFOs: Utilize a professional-grade DCF model for accurate financial reporting and analysis.
- Consultants: Efficiently customize the template for client valuation reports.
- Entrepreneurs: Acquire knowledge of financial modeling practices employed by leading automotive companies.
- Educators: Implement it as a teaching resource to illustrate valuation techniques.
What the Template Contains
- Operating and Balance Sheet Data: Pre-filled Motorcar Parts of America, Inc. (MPAA) historical data and forecasts, including revenue, EBITDA, EBIT, and capital expenditures.
- WACC Calculation: A dedicated sheet for Weighted Average Cost of Capital (WACC), including parameters like Beta, risk-free rate, and share price.
- DCF Valuation (Unlevered and Levered): Editable Discounted Cash Flow models showing intrinsic value with detailed calculations.
- Financial Statements: Pre-loaded financial statements (annual and quarterly) to support analysis.
- Key Ratios: Includes profitability, leverage, and efficiency ratios for Motorcar Parts of America, Inc. (MPAA).
- Dashboard and Charts: Visual summary of valuation outputs and assumptions to analyze results easily.
Disclaimer
All information, articles, and product details provided on this website are for general informational and educational purposes only. We do not claim any ownership over, nor do we intend to infringe upon, any trademarks, copyrights, logos, brand names, or other intellectual property mentioned or depicted on this site. Such intellectual property remains the property of its respective owners, and any references here are made solely for identification or informational purposes, without implying any affiliation, endorsement, or partnership.
We make no representations or warranties, express or implied, regarding the accuracy, completeness, or suitability of any content or products presented. Nothing on this website should be construed as legal, tax, investment, financial, medical, or other professional advice. In addition, no part of this site—including articles or product references—constitutes a solicitation, recommendation, endorsement, advertisement, or offer to buy or sell any securities, franchises, or other financial instruments, particularly in jurisdictions where such activity would be unlawful.
All content is of a general nature and may not address the specific circumstances of any individual or entity. It is not a substitute for professional advice or services. Any actions you take based on the information provided here are strictly at your own risk. You accept full responsibility for any decisions or outcomes arising from your use of this website and agree to release us from any liability in connection with your use of, or reliance upon, the content or products found herein.