
|
MSC Industrial Direct Co., Inc. (MSM) Évaluation DCF |
Entièrement Modifiable: Adapté À Vos Besoins Dans Excel Ou Sheets
Conception Professionnelle: Modèles Fiables Et Conformes Aux Normes Du Secteur
Pré-Construits Pour Une Utilisation Rapide Et Efficace
Compatible MAC/PC, entièrement débloqué
Aucune Expertise N'Est Requise; Facile À Suivre
MSC Industrial Direct Co., Inc. (MSM) Bundle
Vous cherchez à déterminer la valeur intrinsèque de MSC Industrial Direct Co., Inc.? Notre calculatrice MSM DCF intègre des données réelles avec des fonctionnalités de personnalisation étendues, vous permettant d'ajuster les projections et d'améliorer vos choix d'investissement.
What You Will Get
- Editable Excel Template: A fully customizable Excel-based DCF Calculator featuring pre-filled real MSM financials.
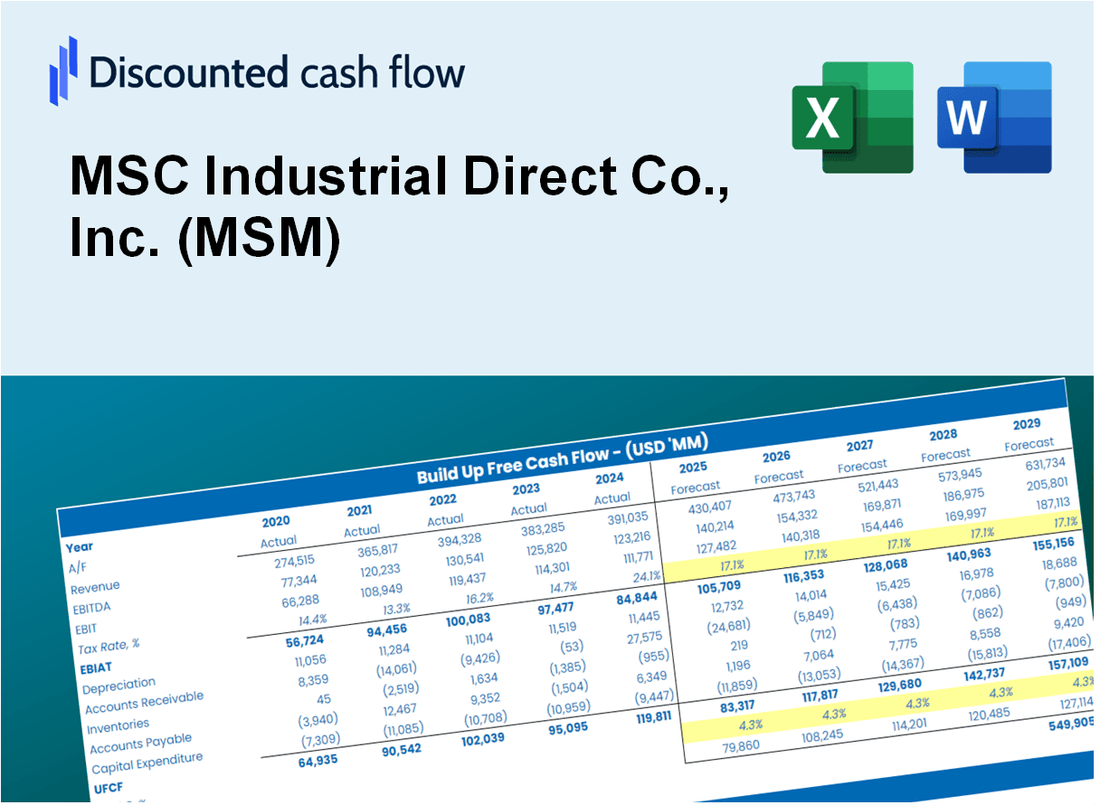
- Real-World Data: Access to historical data and forward-looking estimates (as indicated in the yellow cells).
- Forecast Flexibility: Adjust forecast assumptions such as revenue growth, EBITDA %, and WACC.
- Automatic Calculations: Instantly observe how your inputs affect MSC Industrial Direct's valuation.
- Professional Tool: Designed for investors, CFOs, consultants, and financial analysts.
- User-Friendly Design: Organized for clarity and ease of use, complete with step-by-step instructions.
Key Features
- Comprehensive DCF Calculator: Offers both unlevered and levered DCF valuation models tailored for MSC Industrial Direct Co., Inc. (MSM).
- WACC Calculator: Features a pre-configured Weighted Average Cost of Capital sheet with adjustable parameters.
- Customizable Forecast Assumptions: Easily alter growth rates, capital expenditures, and discount rates to fit your analysis.
- Integrated Financial Ratios: Evaluate profitability, leverage, and efficiency ratios specific to MSC Industrial Direct Co., Inc. (MSM).
- Interactive Dashboard and Charts: Visual representations highlight essential valuation metrics for straightforward interpretation.
How It Works
- Step 1: Download the prebuilt Excel template featuring MSC Industrial Direct Co., Inc. (MSM) data.
- Step 2: Review the pre-filled sheets to familiarize yourself with the essential metrics.
- Step 3: Modify forecasts and assumptions in the editable yellow cells (WACC, growth, margins).
- Step 4: Instantly see recalculated results, including MSC Industrial Direct Co., Inc.'s (MSM) intrinsic value.
- Step 5: Utilize the outputs to make informed investment decisions or create reports.
Why Choose This Calculator for MSC Industrial Direct Co., Inc. (MSM)?
- Reliable Data: Utilize accurate financials from MSC Industrial for trustworthy valuation outcomes.
- Flexible Options: Tailor essential variables such as growth rates, WACC, and tax rates to fit your forecasts.
- Efficiency Boost: Ready-to-use calculations save you time and effort.
- Expert-Level Tool: Crafted for investors, analysts, and industry consultants.
- Easy to Use: User-friendly design and clear guidance make it accessible for everyone.
Who Should Use This Product?
- Individual Investors: Make informed decisions about buying or selling MSC Industrial Direct Co., Inc. (MSM) stock.
- Financial Analysts: Streamline valuation processes with ready-to-use financial models tailored for MSC Industrial Direct Co., Inc. (MSM).
- Consultants: Deliver professional valuation insights on MSC Industrial Direct Co., Inc. (MSM) to clients quickly and accurately.
- Business Owners: Understand how companies like MSC Industrial Direct Co., Inc. (MSM) are valued to inform your own business strategy.
- Finance Students: Learn valuation techniques using real-world data and scenarios related to MSC Industrial Direct Co., Inc. (MSM).
What the Template Contains
- Operating and Balance Sheet Data: Pre-filled MSC Industrial Direct historical data and forecasts, including revenue, EBITDA, EBIT, and capital expenditures.
- WACC Calculation: A dedicated sheet for Weighted Average Cost of Capital (WACC), featuring parameters such as Beta, risk-free rate, and share price.
- DCF Valuation (Unlevered and Levered): Editable Discounted Cash Flow models illustrating intrinsic value with comprehensive calculations.
- Financial Statements: Pre-loaded financial statements (annual and quarterly) to facilitate analysis.
- Key Ratios: Includes profitability, leverage, and efficiency ratios for MSC Industrial Direct (MSM).
- Dashboard and Charts: Visual summary of valuation outputs and assumptions for easy result analysis.
Disclaimer
All information, articles, and product details provided on this website are for general informational and educational purposes only. We do not claim any ownership over, nor do we intend to infringe upon, any trademarks, copyrights, logos, brand names, or other intellectual property mentioned or depicted on this site. Such intellectual property remains the property of its respective owners, and any references here are made solely for identification or informational purposes, without implying any affiliation, endorsement, or partnership.
We make no representations or warranties, express or implied, regarding the accuracy, completeness, or suitability of any content or products presented. Nothing on this website should be construed as legal, tax, investment, financial, medical, or other professional advice. In addition, no part of this site—including articles or product references—constitutes a solicitation, recommendation, endorsement, advertisement, or offer to buy or sell any securities, franchises, or other financial instruments, particularly in jurisdictions where such activity would be unlawful.
All content is of a general nature and may not address the specific circumstances of any individual or entity. It is not a substitute for professional advice or services. Any actions you take based on the information provided here are strictly at your own risk. You accept full responsibility for any decisions or outcomes arising from your use of this website and agree to release us from any liability in connection with your use of, or reliance upon, the content or products found herein.