
|
MANNATECH, Incorporated (MTEX) Valeure DCF |
Entièrement Modifiable: Adapté À Vos Besoins Dans Excel Ou Sheets
Conception Professionnelle: Modèles Fiables Et Conformes Aux Normes Du Secteur
Pré-Construits Pour Une Utilisation Rapide Et Efficace
Compatible MAC/PC, entièrement débloqué
Aucune Expertise N'Est Requise; Facile À Suivre
Mannatech, Incorporated (MTEX) Bundle
Que vous soyez un investisseur ou un analyste, cette calculatrice DCF (MTEX) est votre ressource incontournable pour une évaluation précise. Avec de vraies données de Mannatech, incorporées, vous pouvez ajuster les prévisions et observer immédiatement les effets.
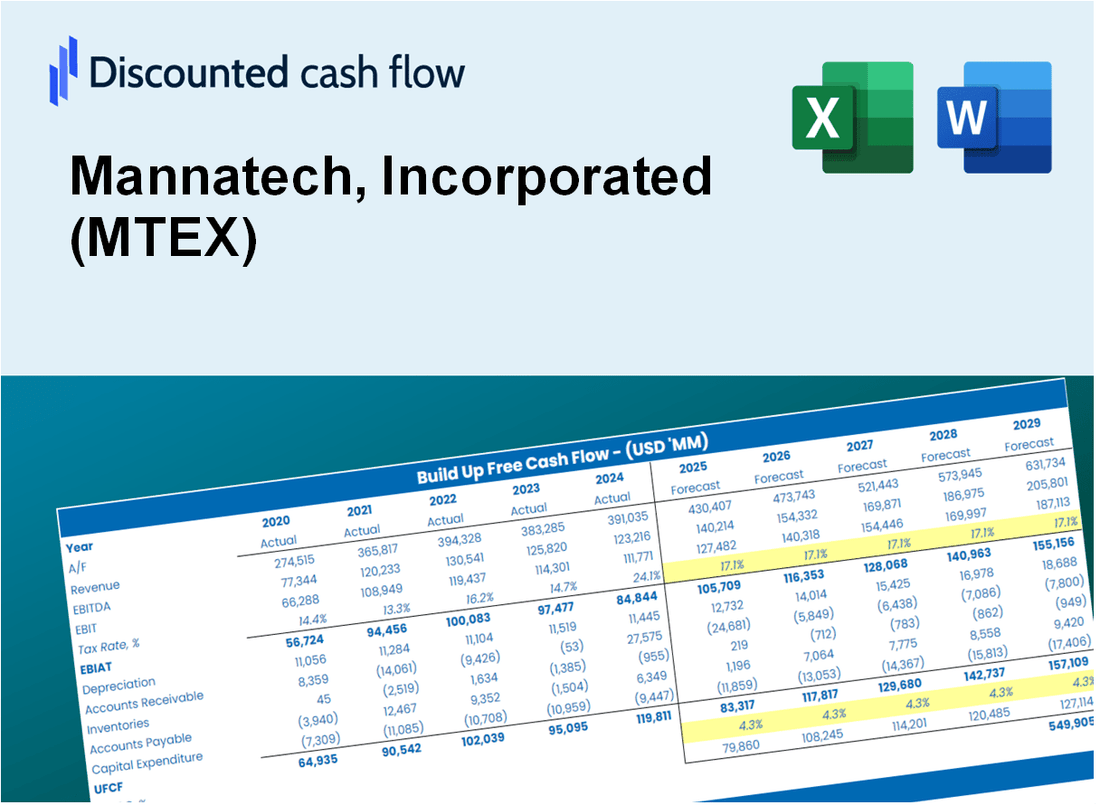
Discounted Cash Flow (DCF) - (USD MM)
| Year | AY1 2020 |
AY2 2021 |
AY3 2022 |
AY4 2023 |
AY5 2024 |
FY1 2025 |
FY2 2026 |
FY3 2027 |
FY4 2028 |
FY5 2029 |
|---|---|---|---|---|---|---|---|---|---|---|
| Revenue | 151.4 | 159.8 | 137.2 | 132.0 | 117.9 | 111.1 | 104.6 | 98.6 | 92.9 | 87.5 |
| Revenue Growth, % | 0 | 5.52 | -14.12 | -3.83 | -10.68 | -5.78 | -5.78 | -5.78 | -5.78 | -5.78 |
| EBITDA | 6.5 | 10.8 | 1.3 | .7 | 5.6 | 3.8 | 3.6 | 3.4 | 3.2 | 3.0 |
| EBITDA, % | 4.31 | 6.79 | 0.91758 | 0.532 | 4.71 | 3.45 | 3.45 | 3.45 | 3.45 | 3.45 |
| Depreciation | 2.0 | 1.7 | 1.6 | 1.6 | 1.5 | 1.4 | 1.3 | 1.2 | 1.1 | 1.1 |
| Depreciation, % | 1.31 | 1.08 | 1.19 | 1.23 | 1.3 | 1.22 | 1.22 | 1.22 | 1.22 | 1.22 |
| EBIT | 4.5 | 9.1 | -.4 | -.9 | 4.0 | 2.5 | 2.3 | 2.2 | 2.1 | 2.0 |
| EBIT, % | 2.99 | 5.71 | -0.26821 | -0.70175 | 3.41 | 2.23 | 2.23 | 2.23 | 2.23 | 2.23 |
| Total Cash | 22.2 | 24.2 | 13.8 | 7.7 | 11.4 | 12.3 | 11.6 | 10.9 | 10.3 | 9.7 |
| Total Cash, percent | .0 | .0 | .0 | .0 | .0 | .0 | .0 | .0 | .0 | .0 |
| Account Receivables | 1.2 | .4 | .6 | .6 | .8 | .6 | .5 | .5 | .5 | .5 |
| Account Receivables, % | 0.7886 | 0.2704 | 0.46717 | 0.42136 | 0.64141 | 0.51779 | 0.51779 | 0.51779 | 0.51779 | 0.51779 |
| Inventories | 12.8 | 12.0 | 15.0 | 14.9 | 10.4 | 10.5 | 9.9 | 9.3 | 8.8 | 8.2 |
| Inventories, % | 8.47 | 7.52 | 10.95 | 11.32 | 8.83 | 9.42 | 9.42 | 9.42 | 9.42 | 9.42 |
| Accounts Payable | 4.8 | 4.0 | 4.4 | 4.0 | 2.1 | 3.0 | 2.9 | 2.7 | 2.5 | 2.4 |
| Accounts Payable, % | 3.17 | 2.48 | 3.18 | 3.04 | 1.76 | 2.73 | 2.73 | 2.73 | 2.73 | 2.73 |
| Capital Expenditure | -.9 | -.7 | -1.1 | -.7 | -.3 | -.6 | -.5 | -.5 | -.5 | -.5 |
| Capital Expenditure, % | -0.62679 | -0.40686 | -0.77474 | -0.56686 | -0.25198 | -0.52544 | -0.52544 | -0.52544 | -0.52544 | -0.52544 |
| Tax Rate, % | 33.42 | 33.42 | 33.42 | 33.42 | 33.42 | 33.42 | 33.42 | 33.42 | 33.42 | 33.42 |
| EBITAT | 5.0 | 10.1 | -3.4 | -1.8 | 2.7 | 2.3 | 2.2 | 2.1 | 1.9 | 1.8 |
| Depreciation | ||||||||||
| Changes in Account Receivables | ||||||||||
| Changes in Inventories | ||||||||||
| Changes in Accounts Payable | ||||||||||
| Capital Expenditure | ||||||||||
| UFCF | -3.2 | 11.9 | -5.7 | -1.1 | 6.3 | 4.2 | 3.4 | 3.2 | 3.0 | 2.8 |
| WACC, % | 6.6 | 6.6 | 6.6 | 6.6 | 6.24 | 6.53 | 6.53 | 6.53 | 6.53 | 6.53 |
| PV UFCF | ||||||||||
| SUM PV UFCF | 13.9 | |||||||||
| Long Term Growth Rate, % | 2.00 | |||||||||
| Free cash flow (T + 1) | 3 | |||||||||
| Terminal Value | 63 | |||||||||
| Present Terminal Value | 46 | |||||||||
| Enterprise Value | 60 | |||||||||
| Net Debt | -5 | |||||||||
| Equity Value | 65 | |||||||||
| Diluted Shares Outstanding, MM | 2 | |||||||||
| Equity Value Per Share | 34.38 |
What You Will Receive
- Comprehensive Financial Model: Leveraging Mannatech’s actual data for accurate DCF valuation.
- Complete Forecast Flexibility: Modify revenue growth, profit margins, WACC, and other essential parameters.
- Real-Time Calculations: Automatic updates provide immediate feedback as adjustments are made.
- Professional-Grade Template: A polished Excel file crafted for high-quality valuation presentations.
- Adaptable and Reusable: Designed for versatility, facilitating repeated use for in-depth forecasts.
Key Features
- 🔍 Real-Life MTEX Financials: Pre-filled historical and projected data for Mannatech, Incorporated (MTEX).
- ✏️ Fully Customizable Inputs: Adjust all critical parameters (yellow cells) like WACC, growth %, and tax rates.
- 📊 Professional DCF Valuation: Built-in formulas calculate Mannatech’s intrinsic value using the Discounted Cash Flow method.
- ⚡ Instant Results: Visualize Mannatech’s valuation instantly after making changes.
- Scenario Analysis: Test and compare outcomes for various financial assumptions side-by-side.
How It Works
- Download the Template: Gain immediate access to the Excel-based MTEX DCF Calculator.
- Input Your Assumptions: Modify the yellow-highlighted cells for growth rates, WACC, margins, and other variables.
- Instant Calculations: The model automatically recalculates Mannatech’s intrinsic value.
- Test Scenarios: Experiment with various assumptions to assess potential changes in valuation.
- Analyze and Decide: Utilize the outcomes to inform your investment or financial analysis.
Why Choose Mannatech's Solutions?
- Enhance Wellness: Our products are formulated to support your health and well-being.
- Proven Quality: Rigorously tested ingredients ensure safety and effectiveness.
- Customizable Options: Choose from a range of products to meet your personal health goals.
- Easy to Use: Simple instructions and user-friendly packaging make our products accessible.
- Backed by Research: Supported by scientific studies and a community of satisfied customers.
Who Should Use Mannatech, Incorporated (MTEX)?
- Health Enthusiasts: Discover how to improve wellness through innovative nutritional products.
- Researchers: Utilize scientific studies to explore the benefits of glyconutrients in your work.
- Investors: Evaluate potential growth opportunities and market performance of Mannatech, Incorporated (MTEX).
- Wellness Coaches: Enhance your client offerings with proven products that support health and vitality.
- Entrepreneurs: Learn about the direct selling model and how to build a successful business with Mannatech, Incorporated (MTEX).
What the Template Contains
- Historical Data: Includes Mannatech’s past financials and baseline forecasts.
- DCF and Levered DCF Models: Detailed templates to calculate Mannatech’s intrinsic value.
- WACC Sheet: Pre-built calculations for Weighted Average Cost of Capital.
- Editable Inputs: Modify key drivers like growth rates, EBITDA %, and CAPEX assumptions.
- Quarterly and Annual Statements: A complete breakdown of Mannatech’s financials.
- Interactive Dashboard: Visualize valuation results and projections dynamically.
Disclaimer
All information, articles, and product details provided on this website are for general informational and educational purposes only. We do not claim any ownership over, nor do we intend to infringe upon, any trademarks, copyrights, logos, brand names, or other intellectual property mentioned or depicted on this site. Such intellectual property remains the property of its respective owners, and any references here are made solely for identification or informational purposes, without implying any affiliation, endorsement, or partnership.
We make no representations or warranties, express or implied, regarding the accuracy, completeness, or suitability of any content or products presented. Nothing on this website should be construed as legal, tax, investment, financial, medical, or other professional advice. In addition, no part of this site—including articles or product references—constitutes a solicitation, recommendation, endorsement, advertisement, or offer to buy or sell any securities, franchises, or other financial instruments, particularly in jurisdictions where such activity would be unlawful.
All content is of a general nature and may not address the specific circumstances of any individual or entity. It is not a substitute for professional advice or services. Any actions you take based on the information provided here are strictly at your own risk. You accept full responsibility for any decisions or outcomes arising from your use of this website and agree to release us from any liability in connection with your use of, or reliance upon, the content or products found herein.