
|
Materialise NV (MTLS) DCF Valuation |
Entièrement Modifiable: Adapté À Vos Besoins Dans Excel Ou Sheets
Conception Professionnelle: Modèles Fiables Et Conformes Aux Normes Du Secteur
Pré-Construits Pour Une Utilisation Rapide Et Efficace
Compatible MAC/PC, entièrement débloqué
Aucune Expertise N'Est Requise; Facile À Suivre
Materialise NV (MTLS) Bundle
Interested in determining the intrinsic value of Materialise NV? Our MTLS DCF Calculator integrates real-world data with complete customization features, enabling you to refine your projections and make more informed investment choices.
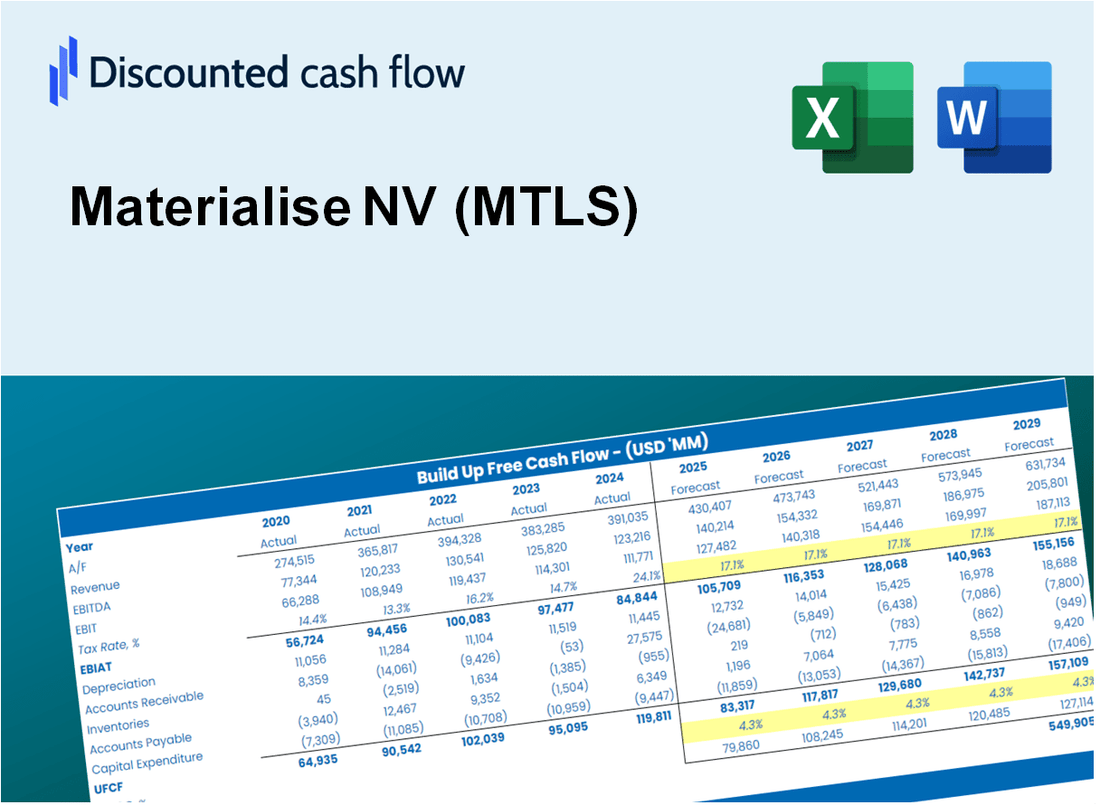
Discounted Cash Flow (DCF) - (USD MM)
| Year | AY1 2021 |
AY2 2022 |
AY3 2023 |
AY4 2024 |
AY5 2025 |
FY1 2026 |
FY2 2027 |
FY3 2028 |
FY4 2029 |
FY5 2030 |
|---|---|---|---|---|---|---|---|---|---|---|
| Revenue | 238.0 | 268.8 | 296.8 | 309.1 | 297.8 | 291.1 | 287.0 | 284.5 | 282.9 | 281.9 |
| Revenue Growth, % | 0 | 12.93 | 10.39 | 4.15 | -3.63 | -2.27 | -1.41 | -0.88058 | -0.54898 | -0.34225 |
| EBITDA | 42.5 | 27.2 | 34.9 | 36.2 | 29.9 | 35.8 | 35.3 | 35.0 | 34.8 | 34.7 |
| EBITDA, % | 17.87 | 10.1 | 11.75 | 11.71 | 10.03 | 12.29 | 12.29 | 12.29 | 12.29 | 12.29 |
| Depreciation | 23.8 | 26.1 | 25.0 | 25.3 | 24.2 | 25.9 | 25.5 | 25.3 | 25.1 | 25.1 |
| Depreciation, % | 10 | 9.73 | 8.42 | 8.17 | 8.11 | 8.89 | 8.89 | 8.89 | 8.89 | 8.89 |
| EBIT | 18.7 | 1.0 | 9.9 | 10.9 | 5.7 | 9.9 | 9.8 | 9.7 | 9.6 | 9.6 |
| EBIT, % | 7.87 | 0.37453 | 3.33 | 3.54 | 1.92 | 3.41 | 3.41 | 3.41 | 3.41 | 3.41 |
| Total Cash | 227.1 | 163.2 | 147.8 | 118.5 | 155.1 | 172.5 | 170.1 | 168.6 | 167.7 | 167.1 |
| Total Cash, percent | .0 | .0 | .0 | .0 | .0 | .0 | .0 | .0 | .0 | .0 |
| Account Receivables | 52.4 | 63.4 | 61.1 | 61.5 | 63.6 | 62.5 | 61.7 | 61.1 | 60.8 | 60.6 |
| Account Receivables, % | 22.01 | 23.6 | 20.57 | 19.89 | 21.36 | 21.49 | 21.49 | 21.49 | 21.49 | 21.49 |
| Inventories | 12.5 | 17.9 | 19.7 | 19.7 | 17.3 | 17.1 | 17.1 | 17.2 | 17.3 | 17.4 |
| Inventories, % | 5.26 | 6.65 | 6.65 | 6.37 | 5.8 | 5.87 | 5.95 | 6.03 | 6.11 | 6.19 |
| Accounts Payable | 23.4 | 26.9 | 24.6 | 27.1 | 23.3 | 26.0 | 25.6 | 25.4 | 25.3 | 25.2 |
| Accounts Payable, % | 9.82 | 10.01 | 8.28 | 8.75 | 7.83 | 8.94 | 8.94 | 8.94 | 8.94 | 8.94 |
| Capital Expenditure | -13.6 | -28.7 | -13.6 | -30.6 | -15.7 | -21.0 | -20.7 | -20.6 | -20.4 | -20.4 |
| Capital Expenditure, % | -5.71 | -10.68 | -4.59 | -9.89 | -5.27 | -7.23 | -7.23 | -7.23 | -7.23 | -7.23 |
| Tax Rate, % | -5.91 | -5.91 | -5.91 | -5.91 | -5.91 | -5.91 | -5.91 | -5.91 | -5.91 | -5.91 |
| EBITAT | 17.9 | 1.8 | 9.8 | 10.4 | 6.1 | 9.7 | 9.6 | 9.5 | 9.4 | 9.4 |
| Depreciation | ||||||||||
| Changes in Account Receivables | ||||||||||
| Changes in Inventories | ||||||||||
| Changes in Accounts Payable | ||||||||||
| Capital Expenditure | ||||||||||
| UFCF | -13.4 | -13.6 | 19.3 | 7.2 | 11.1 | 18.5 | 14.9 | 14.5 | 14.2 | 14.1 |
| WACC, % | 9.16 | 9.23 | 9.22 | 9.15 | 9.23 | 9.2 | 9.2 | 9.2 | 9.2 | 9.2 |
| PV UFCF | ||||||||||
| SUM PV UFCF | 59.6 | |||||||||
| Long Term Growth Rate, % | 4.00 | |||||||||
| Free cash flow (T + 1) | 15 | |||||||||
| Terminal Value | 281 | |||||||||
| Present Terminal Value | 181 | |||||||||
| Enterprise Value | 241 | |||||||||
| Net Debt | -78 | |||||||||
| Equity Value | 319 | |||||||||
| Diluted Shares Outstanding, MM | 59 | |||||||||
| Equity Value Per Share | 5.40 |
What You Will Receive
- Comprehensive Financial Model: Materialise NV's actual data facilitates accurate DCF valuation.
- Complete Forecast Control: Modify revenue growth, profit margins, WACC, and other essential factors.
- Real-Time Calculations: Automatic updates provide immediate insights as you adjust parameters.
- Professional-Grade Template: A polished Excel file crafted for high-quality valuation presentations.
- Flexible and Reusable: Designed for adaptability, allowing for repeated application in detailed forecasts.
Key Features
- Comprehensive Data: Materialise NV’s historical financial statements and pre-filled projections.
- Customizable Inputs: Modify WACC, tax rates, revenue growth, and EBITDA margins as needed.
- Real-Time Analysis: View Materialise NV’s intrinsic value update instantly.
- Intuitive Visual Outputs: Dashboard graphs illustrate valuation results and essential metrics.
- Designed for Precision: A professional-grade tool for analysts, investors, and finance professionals.
How It Works
- Step 1: Download the Excel file.
- Step 2: Review Materialise NV’s (MTLS) pre-filled financial data and forecasts.
- Step 3: Modify critical inputs like revenue growth, WACC, and tax rates (highlighted cells).
- Step 4: Watch the DCF model update instantly as you tweak assumptions.
- Step 5: Analyze the outputs and use the results for investment decisions.
Why Choose This Calculator for Materialise NV (MTLS)?
- Designed for Experts: A sophisticated tool favored by financial analysts, CFOs, and industry consultants.
- Accurate Data: Materialise NV’s historical and forecasted financials are preloaded for precision.
- Flexible Scenario Analysis: Effortlessly simulate various forecasts and assumptions.
- Comprehensive Outputs: Automatically computes intrinsic value, NPV, and essential financial metrics.
- User-Friendly: Detailed step-by-step instructions facilitate a smooth user experience.
Who Should Use Materialise NV (MTLS)?
- Manufacturers: Optimize production processes with advanced 3D printing solutions.
- Engineers: Streamline product development using cutting-edge software tools.
- Designers: Transform creative concepts into tangible prototypes with ease.
- Researchers: Explore innovative applications of additive manufacturing in various fields.
- Educators and Students: Leverage practical examples of 3D printing technology in academic settings.
What the Template Contains
- Pre-Filled Data: Includes Materialise NV’s historical financials and forecasts.
- Discounted Cash Flow Model: Editable DCF valuation model with automatic calculations.
- Weighted Average Cost of Capital (WACC): A dedicated sheet for calculating WACC based on custom inputs.
- Key Financial Ratios: Analyze Materialise NV’s profitability, efficiency, and leverage.
- Customizable Inputs: Edit revenue growth, margins, and tax rates with ease.
- Clear Dashboard: Charts and tables summarizing key valuation results.
Disclaimer
All information, articles, and product details provided on this website are for general informational and educational purposes only. We do not claim any ownership over, nor do we intend to infringe upon, any trademarks, copyrights, logos, brand names, or other intellectual property mentioned or depicted on this site. Such intellectual property remains the property of its respective owners, and any references here are made solely for identification or informational purposes, without implying any affiliation, endorsement, or partnership.
We make no representations or warranties, express or implied, regarding the accuracy, completeness, or suitability of any content or products presented. Nothing on this website should be construed as legal, tax, investment, financial, medical, or other professional advice. In addition, no part of this site—including articles or product references—constitutes a solicitation, recommendation, endorsement, advertisement, or offer to buy or sell any securities, franchises, or other financial instruments, particularly in jurisdictions where such activity would be unlawful.
All content is of a general nature and may not address the specific circumstances of any individual or entity. It is not a substitute for professional advice or services. Any actions you take based on the information provided here are strictly at your own risk. You accept full responsibility for any decisions or outcomes arising from your use of this website and agree to release us from any liability in connection with your use of, or reliance upon, the content or products found herein.