
|
Natural Alternatives International, Inc. (NAII) Évaluation DCF |
Entièrement Modifiable: Adapté À Vos Besoins Dans Excel Ou Sheets
Conception Professionnelle: Modèles Fiables Et Conformes Aux Normes Du Secteur
Pré-Construits Pour Une Utilisation Rapide Et Efficace
Compatible MAC/PC, entièrement débloqué
Aucune Expertise N'Est Requise; Facile À Suivre
Natural Alternatives International, Inc. (NAII) Bundle
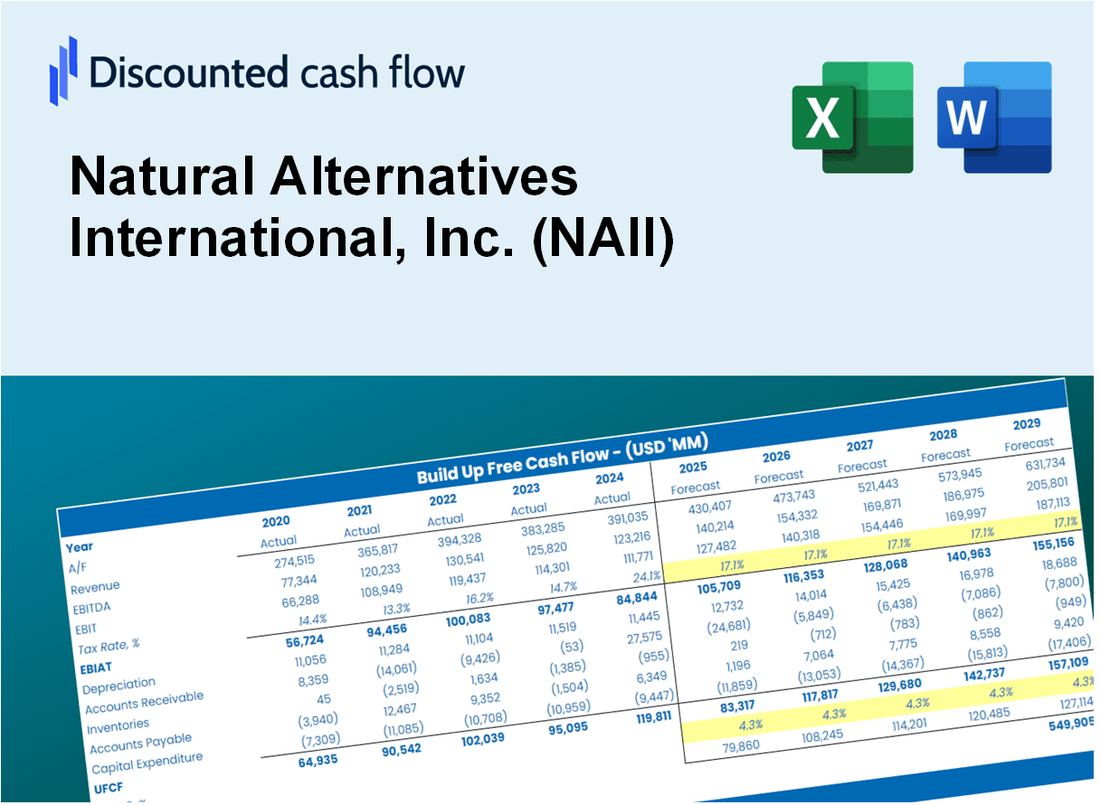
Gardez un aperçu de votre analyse d'évaluation Natural Alternatives International, Inc. (NAII) en utilisant notre calculatrice sophistiquée DCF! Ce modèle Excel est préchargé avec de vraies données NAII, vous permettant d'ajuster les prévisions et les hypothèses pour calculer avec précision la valeur intrinsèque de Natural Alternatives International, Inc. (NAII).
Discounted Cash Flow (DCF) - (USD MM)
| Year | AY1 2020 |
AY2 2021 |
AY3 2022 |
AY4 2023 |
AY5 2024 |
FY1 2025 |
FY2 2026 |
FY3 2027 |
FY4 2028 |
FY5 2029 |
|---|---|---|---|---|---|---|---|---|---|---|
| Revenue | 178.5 | 171.0 | 154.0 | 113.8 | 129.9 | 143.3 | 158.2 | 174.7 | 192.8 | 212.8 |
| Revenue Growth, % | 0 | -4.23 | -9.91 | -26.11 | 14.12 | 10.39 | 10.39 | 10.39 | 10.39 | 10.39 |
| EBITDA | 16.6 | 20.7 | 11.1 | -4.5 | -2.7 | 6.5 | 7.1 | 7.9 | 8.7 | 9.6 |
| EBITDA, % | 9.29 | 12.08 | 7.2 | -3.92 | -2.08 | 4.51 | 4.51 | 4.51 | 4.51 | 4.51 |
| Depreciation | 4.3 | 6.9 | 7.1 | 4.6 | 4.6 | 5.4 | 5.9 | 6.5 | 7.2 | 7.9 |
| Depreciation, % | 2.43 | 4.04 | 4.6 | 4.08 | 3.51 | 3.73 | 3.73 | 3.73 | 3.73 | 3.73 |
| EBIT | 12.2 | 13.7 | 4.0 | -9.1 | -7.3 | 1.1 | 1.2 | 1.4 | 1.5 | 1.7 |
| EBIT, % | 6.86 | 8.04 | 2.6 | -8 | -5.59 | 0.78138 | 0.78138 | 0.78138 | 0.78138 | 0.78138 |
| Total Cash | 32.1 | 21.8 | 13.6 | 12.0 | 12.3 | 17.1 | 18.9 | 20.8 | 23.0 | 25.4 |
| Total Cash, percent | .0 | .0 | .0 | .0 | .0 | .0 | .0 | .0 | .0 | .0 |
| Account Receivables | 19.0 | 17.5 | 7.3 | 16.9 | 14.9 | 14.9 | 16.5 | 18.2 | 20.0 | 22.1 |
| Account Receivables, % | 10.67 | 10.23 | 4.76 | 14.84 | 11.49 | 10.4 | 10.4 | 10.4 | 10.4 | 10.4 |
| Inventories | 27.0 | 32.5 | 29.7 | 24.2 | 24.9 | 26.9 | 29.7 | 32.8 | 36.2 | 40.0 |
| Inventories, % | 15.13 | 19 | 19.28 | 21.31 | 19.15 | 18.77 | 18.77 | 18.77 | 18.77 | 18.77 |
| Accounts Payable | 11.9 | 16.2 | 7.8 | 12.7 | 15.4 | 12.7 | 14.0 | 15.4 | 17.0 | 18.8 |
| Accounts Payable, % | 6.66 | 9.47 | 5.05 | 11.2 | 11.82 | 8.84 | 8.84 | 8.84 | 8.84 | 8.84 |
| Capital Expenditure | -5.1 | -26.5 | -13.5 | -3.0 | -3.6 | -9.3 | -10.3 | -11.4 | -12.6 | -13.9 |
| Capital Expenditure, % | -2.86 | -15.49 | -8.78 | -2.65 | -2.78 | -6.51 | -6.51 | -6.51 | -6.51 | -6.51 |
| Tax Rate, % | -26.4 | -26.4 | -26.4 | -26.4 | -26.4 | -26.4 | -26.4 | -26.4 | -26.4 | -26.4 |
| EBITAT | 10.9 | 10.8 | 2.8 | -6.9 | -9.2 | .9 | 1.0 | 1.1 | 1.2 | 1.4 |
| Depreciation | ||||||||||
| Changes in Account Receivables | ||||||||||
| Changes in Inventories | ||||||||||
| Changes in Accounts Payable | ||||||||||
| Capital Expenditure | ||||||||||
| UFCF | -24.1 | -8.4 | .9 | -4.5 | -4.3 | -7.8 | -6.4 | -7.1 | -7.8 | -8.6 |
| WACC, % | 3.79 | 3.5 | 3.29 | 3.44 | 4.11 | 3.63 | 3.63 | 3.63 | 3.63 | 3.63 |
| PV UFCF | ||||||||||
| SUM PV UFCF | -33.8 | |||||||||
| Long Term Growth Rate, % | 0.50 | |||||||||
| Free cash flow (T + 1) | -9 | |||||||||
| Terminal Value | -277 | |||||||||
| Present Terminal Value | -232 | |||||||||
| Enterprise Value | -265 | |||||||||
| Net Debt | 47 | |||||||||
| Equity Value | -312 | |||||||||
| Diluted Shares Outstanding, MM | 6 | |||||||||
| Equity Value Per Share | -52.48 |
What You Will Receive
- Pre-Filled Financial Model: NAII's actual data provides an accurate basis for DCF valuation.
- Comprehensive Forecast Control: Modify revenue growth, profit margins, WACC, and other essential parameters.
- Immediate Calculations: Real-time updates ensure you observe results as you implement changes.
- Professional-Grade Template: A polished Excel file crafted for high-quality valuation purposes.
- Adaptable and Reusable: Designed for versatility, facilitating repeated application for in-depth forecasts.
Key Features
- Pre-Loaded Data: Natural Alternatives International, Inc. (NAII) historical financial statements and pre-filled forecasts.
- Fully Adjustable Inputs: Modify WACC, tax rates, revenue growth, and EBITDA margins as needed.
- Instant Results: View Natural Alternatives International, Inc. (NAII) intrinsic value recalculating in real time.
- Clear Visual Outputs: Dashboard charts illustrate valuation results and essential metrics.
- Built for Accuracy: A professional tool designed for analysts, investors, and finance professionals.
How It Works
- Step 1: Download the Excel file.
- Step 2: Review pre-entered Natural Alternatives International, Inc. (NAII) data (historical and projected).
- Step 3: Adjust key assumptions (yellow cells) based on your analysis.
- Step 4: View automatic recalculations for Natural Alternatives International, Inc. (NAII)’s intrinsic value.
- Step 5: Use the outputs for investment decisions or reporting.
Why Choose This Calculator for Natural Alternatives International, Inc. (NAII)?
- All-in-One Solution: Combines DCF, WACC, and financial ratio analyses tailored for NAII.
- Flexible Inputs: Modify the highlighted cells to explore different financial scenarios for NAII.
- In-Depth Analysis: Automatically computes the intrinsic value and Net Present Value for Natural Alternatives International, Inc. (NAII).
- Preloaded Metrics: Access historical and projected data for precise analysis starting points.
- Expert-Level Tool: Designed for financial analysts, investors, and business advisors focusing on NAII.
Who Should Use This Product?
- Health and Wellness Professionals: Develop comprehensive nutritional product strategies for client needs.
- Corporate Strategy Teams: Evaluate market trends to inform business decisions for growth.
- Consultants and Advisors: Offer clients informed insights into the health supplement industry and NAII's offerings.
- Students and Educators: Utilize industry data to enhance learning in nutrition and business management.
- Health Enthusiasts: Gain a deeper understanding of how companies like Natural Alternatives International, Inc. (NAII) contribute to wellness.
What the Template Contains
- Historical Data: Includes Natural Alternatives International, Inc.’s (NAII) past financials and baseline forecasts.
- DCF and Levered DCF Models: Detailed templates to calculate Natural Alternatives International, Inc.’s (NAII) intrinsic value.
- WACC Sheet: Pre-built calculations for Weighted Average Cost of Capital.
- Editable Inputs: Modify key drivers like growth rates, EBITDA %, and CAPEX assumptions.
- Quarterly and Annual Statements: A complete breakdown of Natural Alternatives International, Inc.’s (NAII) financials.
- Interactive Dashboard: Visualize valuation results and projections dynamically.
Disclaimer
All information, articles, and product details provided on this website are for general informational and educational purposes only. We do not claim any ownership over, nor do we intend to infringe upon, any trademarks, copyrights, logos, brand names, or other intellectual property mentioned or depicted on this site. Such intellectual property remains the property of its respective owners, and any references here are made solely for identification or informational purposes, without implying any affiliation, endorsement, or partnership.
We make no representations or warranties, express or implied, regarding the accuracy, completeness, or suitability of any content or products presented. Nothing on this website should be construed as legal, tax, investment, financial, medical, or other professional advice. In addition, no part of this site—including articles or product references—constitutes a solicitation, recommendation, endorsement, advertisement, or offer to buy or sell any securities, franchises, or other financial instruments, particularly in jurisdictions where such activity would be unlawful.
All content is of a general nature and may not address the specific circumstances of any individual or entity. It is not a substitute for professional advice or services. Any actions you take based on the information provided here are strictly at your own risk. You accept full responsibility for any decisions or outcomes arising from your use of this website and agree to release us from any liability in connection with your use of, or reliance upon, the content or products found herein.