
|
Nippon Life India Asset Management Limited (NAM-India.NS) DCF Valation |
Entièrement Modifiable: Adapté À Vos Besoins Dans Excel Ou Sheets
Conception Professionnelle: Modèles Fiables Et Conformes Aux Normes Du Secteur
Pré-Construits Pour Une Utilisation Rapide Et Efficace
Compatible MAC/PC, entièrement débloqué
Aucune Expertise N'Est Requise; Facile À Suivre
Nippon Life India Asset Management Limited (NAM-INDIA.NS) Bundle
Améliorez votre stratégie d'investissement avec la calculatrice DCF (Nam-Indiens)! Utilisez des données financières authentiques de Nippon Life India Asset Management Limited, ajustez les projections et dépenses de croissance et observez instantanément comment ces modifications affectent la valeur intrinsèque des (nam-Indiens).
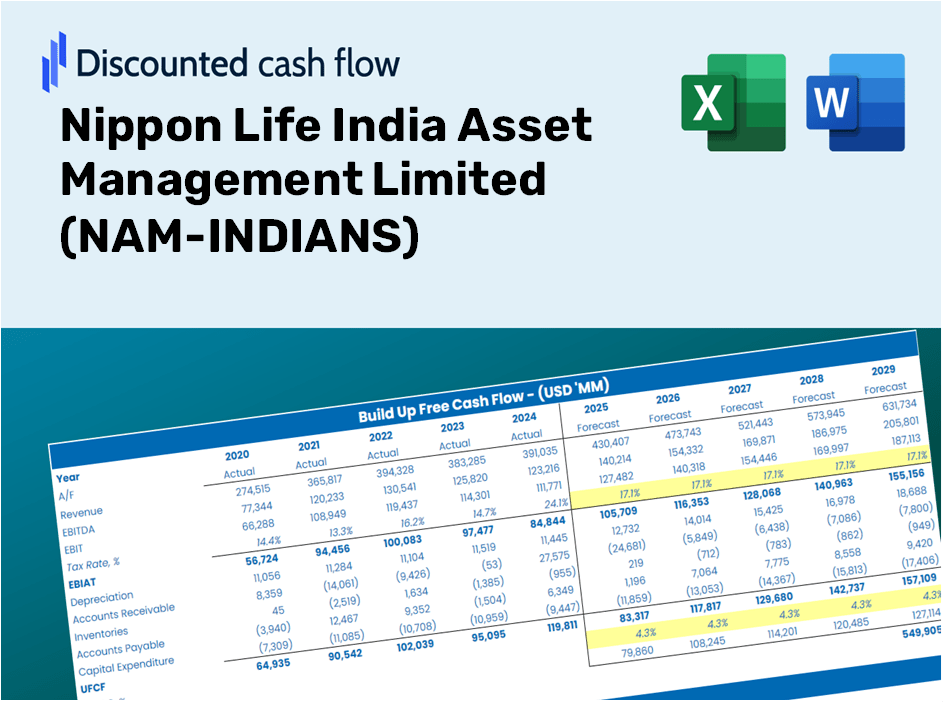
Discounted Cash Flow (DCF) - (USD MM)
| Year | AY1 2021 |
AY2 2022 |
AY3 2023 |
AY4 2024 |
AY5 2025 |
FY1 2026 |
FY2 2027 |
FY3 2028 |
FY4 2029 |
FY5 2030 |
|---|---|---|---|---|---|---|---|---|---|---|
| Revenue | 14,193.4 | 15,356.2 | 15,166.1 | 20,373.4 | 25,207.2 | 29,304.4 | 34,067.5 | 39,604.8 | 46,042.1 | 53,525.8 |
| Revenue Growth, % | 0 | 8.19 | -1.24 | 34.34 | 23.73 | 16.25 | 16.25 | 16.25 | 16.25 | 16.25 |
| EBITDA | 9,147.2 | 10,197.0 | 9,615.0 | 13,878.6 | 17,316.6 | 19,403.4 | 22,557.2 | 26,223.6 | 30,486.0 | 35,441.2 |
| EBITDA, % | 64.45 | 66.4 | 63.4 | 68.12 | 68.7 | 66.21 | 66.21 | 66.21 | 66.21 | 66.21 |
| Depreciation | 332.7 | 272.2 | 297.9 | 291.4 | 306.0 | 511.4 | 594.5 | 691.1 | 803.4 | 934.0 |
| Depreciation, % | 2.34 | 1.77 | 1.96 | 1.43 | 1.21 | 1.75 | 1.75 | 1.75 | 1.75 | 1.75 |
| EBIT | 8,814.5 | 9,924.8 | 9,317.1 | 13,587.2 | 17,010.6 | 18,892.0 | 21,962.7 | 25,532.5 | 29,682.5 | 34,507.1 |
| EBIT, % | 62.1 | 64.63 | 61.43 | 66.69 | 67.48 | 64.47 | 64.47 | 64.47 | 64.47 | 64.47 |
| Total Cash | 3,596.4 | 28,580.4 | 2,727.4 | 30,441.8 | 26,516.3 | 20,121.7 | 23,392.2 | 27,194.4 | 31,614.6 | 36,753.2 |
| Total Cash, percent | .0 | .0 | .0 | .0 | .0 | .0 | .0 | .0 | .0 | .0 |
| Account Receivables | 536.1 | 874.7 | 1,012.8 | 1,367.5 | 707.4 | 1,504.5 | 1,749.0 | 2,033.3 | 2,363.8 | 2,748.0 |
| Account Receivables, % | 3.78 | 5.7 | 6.68 | 6.71 | 2.81 | 5.13 | 5.13 | 5.13 | 5.13 | 5.13 |
| Inventories | .0 | -28,180.3 | -28,992.3 | .0 | .0 | -11,721.7 | -13,627.0 | -15,841.9 | -18,416.8 | -21,410.3 |
| Inventories, % | 0 | -183.51 | -191.17 | 0 | 0 | -40 | -40 | -40 | -40 | -40 |
| Accounts Payable | 628.7 | 559.5 | 662.0 | 495.5 | 589.0 | 1,008.5 | 1,172.4 | 1,362.9 | 1,584.5 | 1,842.0 |
| Accounts Payable, % | 4.43 | 3.64 | 4.36 | 2.43 | 2.34 | 3.44 | 3.44 | 3.44 | 3.44 | 3.44 |
| Capital Expenditure | -196.5 | -68.2 | -103.8 | -118.8 | -5,410.0 | -1,439.3 | -1,673.3 | -1,945.2 | -2,261.4 | -2,629.0 |
| Capital Expenditure, % | -1.38 | -0.44412 | -0.68442 | -0.58311 | -21.46 | -4.91 | -4.91 | -4.91 | -4.91 | -4.91 |
| Tax Rate, % | 24.11 | 24.11 | 24.11 | 24.11 | 24.11 | 24.11 | 24.11 | 24.11 | 24.11 | 24.11 |
| EBITAT | 6,837.7 | 7,470.2 | 7,264.3 | 11,124.3 | 12,910.0 | 14,681.9 | 17,068.3 | 19,842.6 | 23,067.8 | 26,817.2 |
| Depreciation | ||||||||||
| Changes in Account Receivables | ||||||||||
| Changes in Inventories | ||||||||||
| Changes in Accounts Payable | ||||||||||
| Capital Expenditure | ||||||||||
| UFCF | 7,066.5 | 35,446.7 | 8,234.8 | -18,216.6 | 8,559.6 | 25,098.1 | 17,814.1 | 20,709.6 | 24,075.8 | 27,989.0 |
| WACC, % | 7.77 | 7.77 | 7.77 | 7.77 | 7.77 | 7.77 | 7.77 | 7.77 | 7.77 | 7.77 |
| PV UFCF | ||||||||||
| SUM PV UFCF | 92,283.9 | |||||||||
| Long Term Growth Rate, % | 2.00 | |||||||||
| Free cash flow (T + 1) | 28,549 | |||||||||
| Terminal Value | 495,151 | |||||||||
| Present Terminal Value | 340,672 | |||||||||
| Enterprise Value | 432,955 | |||||||||
| Net Debt | -1,997 | |||||||||
| Equity Value | 434,952 | |||||||||
| Diluted Shares Outstanding, MM | 642 | |||||||||
| Equity Value Per Share | 677.25 |
What You Will Receive
- Genuine NAM-INDIANS Data: Preloaded financial information – covering everything from revenue to EBIT – utilizing actual and projected metrics.
- Complete Customization: Modify all essential parameters (yellow cells) such as WACC, growth %, and tax rates.
- Real-Time Valuation Updates: Automatic recalculations allowing you to assess the effect of changes on NAM-INDIANS’ fair value.
- Flexible Excel Template: Designed for rapid adjustments, scenario analysis, and comprehensive projections.
- Efficiency and Precision: Eliminate the need to build models from the ground up while ensuring accuracy and adaptability.
Key Features
- Customizable Forecast Inputs: Adjust essential variables such as revenue growth, EBITDA %, and capital expenditure with ease.
- Instant DCF Valuation: Automatically determines intrinsic value, NPV, and more within moments.
- Accurate Financial Insights: Leverages Nippon Life's real-world financial data for dependable valuation results.
- Effortless Scenario Analysis: Evaluate various assumptions and effortlessly compare their results.
- Efficiency Booster: Save time by avoiding the construction of intricate valuation models from the ground up.
How It Functions
- 1. Access the Template: Download and open the Excel file containing Nippon Life India Asset Management Limited’s (NAM-INDIANS) preloaded data.
- 2. Modify Assumptions: Adjust essential inputs such as growth rates, WACC, and capital expenditures.
- 3. View Results Instantly: The DCF model automatically calculates the intrinsic value and NPV.
- 4. Explore Scenarios: Analyze various forecasts to evaluate different valuation outcomes.
- 5. Utilize with Assurance: Present professional valuation insights to enhance your decision-making.
Why Choose This Calculator for Nippon Life India Asset Management Limited (NAM-INDIANS)?
- Precision: Leverages genuine Nippon Life financial data for high accuracy.
- Versatility: Allows users to easily experiment and adjust inputs as needed.
- Efficiency: Bypass the complexities of constructing a financial model from the ground up.
- Expert-Level: Crafted with precision and functionality reflective of top-level finance professionals.
- Accessible: Intuitive interface, suitable for users without extensive financial modeling expertise.
Who Can Benefit from This Product?
- Individual Investors: Gain insights to make well-informed decisions regarding your investments in Nippon Life India Asset Management Limited (NAM-INDIANS).
- Financial Analysts: Enhance your valuation processes with convenient and accessible financial models tailored for NAM-INDIANS.
- Consultants: Provide your clients with precise and timely valuation insights for NAM-INDIANS.
- Business Owners: Learn about the valuation strategies of significant firms like Nippon Life India Asset Management Limited (NAM-INDIANS) to inform your own business tactics.
- Finance Students: Acquire practical knowledge of valuation techniques using real data and scenarios related to NAM-INDIANS.
Contents of the Template
- Pre-Filled DCF Model: Financial data for Nippon Life India Asset Management Limited (NAM-INDIANS) ready for immediate application.
- WACC Calculator: Comprehensive calculations for Weighted Average Cost of Capital tailored to NAM-INDIANS.
- Financial Ratios: Analyze NAM-INDIANS' profitability, leverage, and operational efficiency.
- Editable Inputs: Customize assumptions such as growth rates, profit margins, and CAPEX to align with your scenarios.
- Financial Statements: Access annual and quarterly reports for in-depth analysis.
- Interactive Dashboard: Effortlessly visualize essential valuation metrics and outcomes.
Disclaimer
All information, articles, and product details provided on this website are for general informational and educational purposes only. We do not claim any ownership over, nor do we intend to infringe upon, any trademarks, copyrights, logos, brand names, or other intellectual property mentioned or depicted on this site. Such intellectual property remains the property of its respective owners, and any references here are made solely for identification or informational purposes, without implying any affiliation, endorsement, or partnership.
We make no representations or warranties, express or implied, regarding the accuracy, completeness, or suitability of any content or products presented. Nothing on this website should be construed as legal, tax, investment, financial, medical, or other professional advice. In addition, no part of this site—including articles or product references—constitutes a solicitation, recommendation, endorsement, advertisement, or offer to buy or sell any securities, franchises, or other financial instruments, particularly in jurisdictions where such activity would be unlawful.
All content is of a general nature and may not address the specific circumstances of any individual or entity. It is not a substitute for professional advice or services. Any actions you take based on the information provided here are strictly at your own risk. You accept full responsibility for any decisions or outcomes arising from your use of this website and agree to release us from any liability in connection with your use of, or reliance upon, the content or products found herein.