
|
NACCO Industries, Inc. (NC) Évaluation DCF |
Entièrement Modifiable: Adapté À Vos Besoins Dans Excel Ou Sheets
Conception Professionnelle: Modèles Fiables Et Conformes Aux Normes Du Secteur
Pré-Construits Pour Une Utilisation Rapide Et Efficace
Compatible MAC/PC, entièrement débloqué
Aucune Expertise N'Est Requise; Facile À Suivre
NACCO Industries, Inc. (NC) Bundle
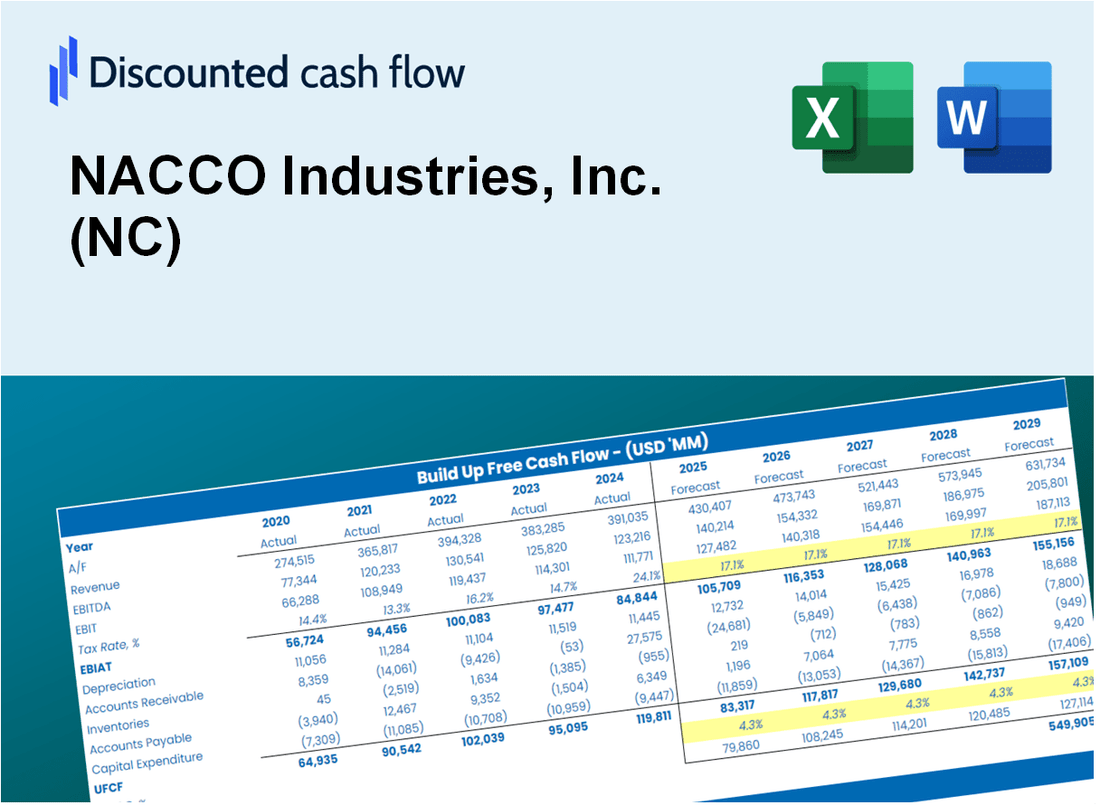
Rationalisez votre analyse et améliorez la précision avec notre calculatrice DCF (NC)! En utilisant des données Real Nacco Industries, Inc. et des hypothèses personnalisables, cet outil vous permet de prévoir, d'analyser et d'évaluer NACCO Industries, Inc. comme un investisseur chevronné.
What You Will Get
- Editable Forecast Inputs: Easily modify assumptions (growth %, margins, WACC) to explore various scenarios.
- Real-World Data: NACCO Industries, Inc. (NC)’s financial data pre-filled to kickstart your evaluation.
- Automatic DCF Outputs: The template computes Net Present Value (NPV) and intrinsic value automatically.
- Customizable and Professional: A refined Excel model that tailors to your valuation requirements.
- Built for Analysts and Investors: Perfect for assessing projections, validating strategies, and enhancing efficiency.
Key Features
- Customizable Financial Metrics: Adjust essential inputs such as revenue forecasts, operating margins, and capital investments.
- Instant DCF Valuation: Automatically computes intrinsic value, net present value (NPV), and additional financial metrics.
- High-Precision Accuracy: Leverages NACCO Industries, Inc.’s (NC) actual financial data for credible valuation results.
- Effortless Scenario Analysis: Easily evaluate various assumptions and analyze different outcomes.
- Efficiency Booster: Streamline the valuation process without the hassle of creating intricate models from the ground up.
How It Works
- Download the Template: Gain immediate access to the Excel-based NACCO Industries, Inc. (NC) DCF Calculator.
- Input Your Assumptions: Modify the yellow-highlighted cells for growth rates, WACC, margins, and other key metrics.
- Instant Calculations: The model automatically recalculates NACCO's intrinsic value.
- Test Scenarios: Explore various assumptions to assess potential changes in valuation.
- Analyze and Decide: Utilize the outcomes to inform your investment or financial analysis.
Why Choose This Calculator for NACCO Industries, Inc. (NC)?
- Accurate Data: Reliable NACCO financials provide trustworthy valuation outcomes.
- Customizable: Tailor key inputs such as growth rates, WACC, and tax rates to fit your forecasts.
- Time-Saving: Pre-configured calculations save you the hassle of starting from scratch.
- Professional-Grade Tool: Crafted for investors, analysts, and consultants focused on NACCO.
- User-Friendly: An intuitive design and clear instructions make it accessible for all users.
Who Should Use This Product?
- Professional Investors: Develop comprehensive and accurate valuation models for portfolio assessments of NACCO Industries, Inc. (NC).
- Corporate Finance Teams: Evaluate valuation scenarios to inform strategic decisions within the company.
- Consultants and Advisors: Offer clients precise valuation insights for NACCO Industries, Inc. (NC) stock.
- Students and Educators: Utilize real-world data to enhance learning and practice in financial modeling.
- Industry Analysts: Gain insights into the valuation metrics specific to NACCO Industries, Inc. (NC).
What the NACCO Industries, Inc. (NC) Template Contains
- Comprehensive DCF Model: Editable template featuring detailed valuation calculations tailored for NACCO Industries.
- Real-World Data: NACCO’s historical and projected financials preloaded for thorough analysis.
- Customizable Parameters: Modify WACC, growth rates, and tax assumptions to explore various scenarios.
- Financial Statements: Complete annual and quarterly breakdowns for enhanced insights into NACCO's performance.
- Key Ratios: Integrated analysis for profitability, efficiency, and leverage specific to NACCO Industries.
- Dashboard with Visual Outputs: Charts and tables designed for clear, actionable results relevant to NACCO Industries, Inc. (NC).
Disclaimer
All information, articles, and product details provided on this website are for general informational and educational purposes only. We do not claim any ownership over, nor do we intend to infringe upon, any trademarks, copyrights, logos, brand names, or other intellectual property mentioned or depicted on this site. Such intellectual property remains the property of its respective owners, and any references here are made solely for identification or informational purposes, without implying any affiliation, endorsement, or partnership.
We make no representations or warranties, express or implied, regarding the accuracy, completeness, or suitability of any content or products presented. Nothing on this website should be construed as legal, tax, investment, financial, medical, or other professional advice. In addition, no part of this site—including articles or product references—constitutes a solicitation, recommendation, endorsement, advertisement, or offer to buy or sell any securities, franchises, or other financial instruments, particularly in jurisdictions where such activity would be unlawful.
All content is of a general nature and may not address the specific circumstances of any individual or entity. It is not a substitute for professional advice or services. Any actions you take based on the information provided here are strictly at your own risk. You accept full responsibility for any decisions or outcomes arising from your use of this website and agree to release us from any liability in connection with your use of, or reliance upon, the content or products found herein.