
|
NEOGER CORPORATION (NEOG) Évaluation DCF |
Entièrement Modifiable: Adapté À Vos Besoins Dans Excel Ou Sheets
Conception Professionnelle: Modèles Fiables Et Conformes Aux Normes Du Secteur
Pré-Construits Pour Une Utilisation Rapide Et Efficace
Compatible MAC/PC, entièrement débloqué
Aucune Expertise N'Est Requise; Facile À Suivre
Neogen Corporation (NEOG) Bundle
Améliorez vos choix d'investissement avec la calculatrice DCF de Neogen Corporation (NEOG)! Explorez des données financières authentiques pour Neogen, ajustez les prédictions et les dépenses de croissance et observez instantanément comment ces modifications affectent la valeur intrinsèque de Neogen Corporation (NEOG).
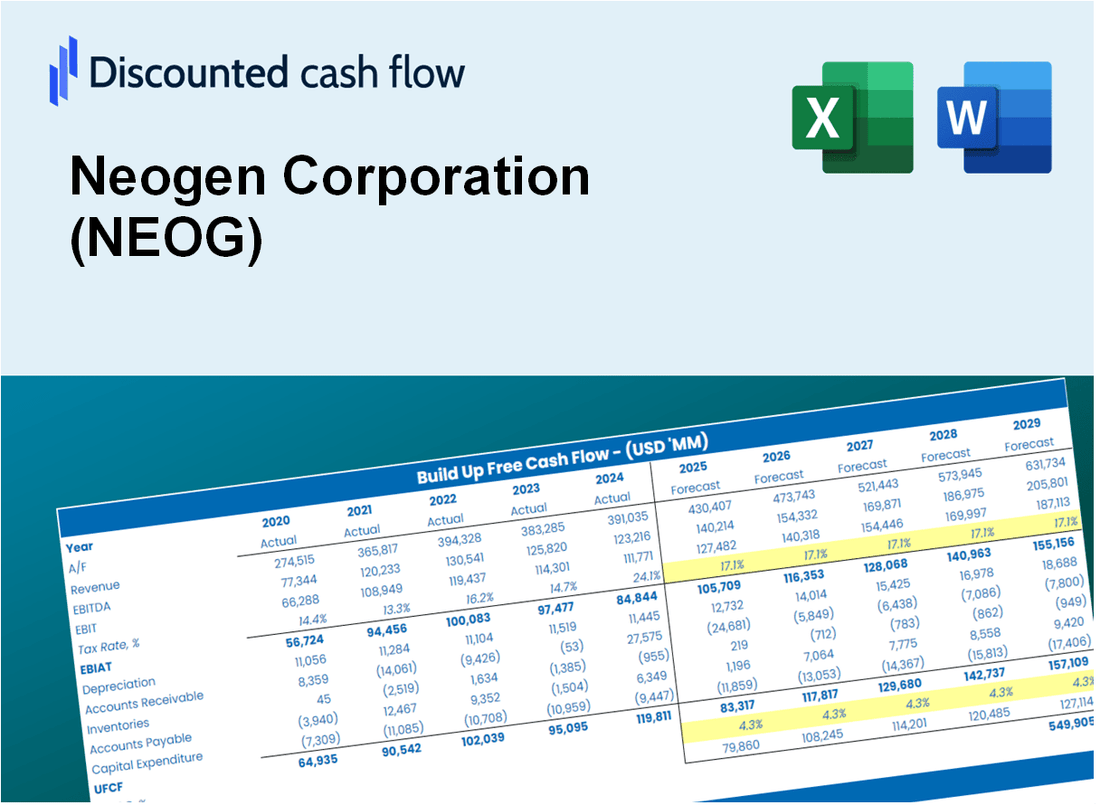
Discounted Cash Flow (DCF) - (USD MM)
| Year | AY1 2021 |
AY2 2022 |
AY3 2023 |
AY4 2024 |
AY5 2025 |
FY1 2026 |
FY2 2027 |
FY3 2028 |
FY4 2029 |
FY5 2030 |
|---|---|---|---|---|---|---|---|---|---|---|
| Revenue | 468.5 | 527.2 | 822.4 | 924.2 | 894.7 | 1,068.5 | 1,276.1 | 1,524.1 | 1,820.2 | 2,173.9 |
| Revenue Growth, % | 0 | 12.53 | 56.01 | 12.37 | -3.2 | 19.43 | 19.43 | 19.43 | 19.43 | 19.43 |
| EBITDA | 96.3 | 83.9 | 122.3 | 182.6 | -937.8 | -61.8 | -73.8 | -88.1 | -105.2 | -125.6 |
| EBITDA, % | 20.56 | 15.92 | 14.87 | 19.76 | -104.82 | -5.78 | -5.78 | -5.78 | -5.78 | -5.78 |
| Depreciation | 21.0 | 23.7 | 88.4 | 121.2 | 125.7 | 100.2 | 119.7 | 142.9 | 170.7 | 203.9 |
| Depreciation, % | 4.49 | 4.49 | 10.75 | 13.12 | 14.05 | 9.38 | 9.38 | 9.38 | 9.38 | 9.38 |
| EBIT | 75.3 | 60.2 | 33.9 | 61.4 | -1,063.4 | -132.0 | -157.6 | -188.2 | -224.8 | -268.5 |
| EBIT, % | 16.07 | 11.42 | 4.12 | 6.64 | -118.86 | -12.35 | -12.35 | -12.35 | -12.35 | -12.35 |
| Total Cash | 381.1 | 381.1 | 245.6 | 170.9 | 129.0 | 462.5 | 552.3 | 659.6 | 787.8 | 940.9 |
| Total Cash, percent | .0 | .0 | .0 | .0 | .0 | .0 | .0 | .0 | .0 | .0 |
| Account Receivables | 91.8 | 99.7 | 153.3 | 173.0 | 153.4 | 198.8 | 237.4 | 283.5 | 338.6 | 404.4 |
| Account Receivables, % | 19.6 | 18.91 | 18.63 | 18.72 | 17.14 | 18.6 | 18.6 | 18.6 | 18.6 | 18.6 |
| Inventories | 100.7 | 122.3 | 133.8 | 189.3 | 190.9 | 219.6 | 262.3 | 313.3 | 374.2 | 446.9 |
| Inventories, % | 21.5 | 23.2 | 16.27 | 20.48 | 21.33 | 20.56 | 20.56 | 20.56 | 20.56 | 20.56 |
| Accounts Payable | 23.9 | 34.6 | 76.7 | 83.1 | 79.6 | 83.1 | 99.2 | 118.5 | 141.5 | 169.0 |
| Accounts Payable, % | 5.1 | 6.57 | 9.32 | 8.99 | 8.9 | 7.77 | 7.77 | 7.77 | 7.77 | 7.77 |
| Capital Expenditure | -26.7 | -24.4 | -65.8 | -111.4 | -104.6 | -89.9 | -107.4 | -128.3 | -153.2 | -182.9 |
| Capital Expenditure, % | -5.7 | -4.63 | -8 | -12.06 | -11.69 | -8.42 | -8.42 | -8.42 | -8.42 | -8.42 |
| Tax Rate, % | 3.62 | 3.62 | 3.62 | 3.62 | 3.62 | 3.62 | 3.62 | 3.62 | 3.62 | 3.62 |
| EBITAT | 60.9 | 48.3 | 35.2 | 40.4 | -1,024.9 | -111.7 | -133.4 | -159.4 | -190.3 | -227.3 |
| Depreciation | ||||||||||
| Changes in Account Receivables | ||||||||||
| Changes in Inventories | ||||||||||
| Changes in Accounts Payable | ||||||||||
| Capital Expenditure | ||||||||||
| UFCF | -113.4 | 28.8 | 34.8 | -18.6 | -989.2 | -172.1 | -186.3 | -222.5 | -265.7 | -317.4 |
| WACC, % | 10.42 | 10.4 | 11.02 | 9.96 | 10.91 | 10.54 | 10.54 | 10.54 | 10.54 | 10.54 |
| PV UFCF | ||||||||||
| SUM PV UFCF | -843.1 | |||||||||
| Long Term Growth Rate, % | 4.00 | |||||||||
| Free cash flow (T + 1) | -330 | |||||||||
| Terminal Value | -5,045 | |||||||||
| Present Terminal Value | -3,056 | |||||||||
| Enterprise Value | -3,899 | |||||||||
| Net Debt | 784 | |||||||||
| Equity Value | -4,683 | |||||||||
| Diluted Shares Outstanding, MM | 217 | |||||||||
| Equity Value Per Share | -21.59 |
What You Will Get
- Real Neogen Data: Preloaded financials – from revenue to EBIT – based on actual and projected figures for Neogen Corporation (NEOG).
- Full Customization: Adjust all critical parameters (yellow cells) like WACC, growth %, and tax rates specific to Neogen Corporation (NEOG).
- Instant Valuation Updates: Automatic recalculations to analyze the impact of changes on Neogen Corporation’s fair value.
- Versatile Excel Template: Tailored for quick edits, scenario testing, and detailed projections for Neogen Corporation (NEOG).
- Time-Saving and Accurate: Skip building models from scratch while maintaining precision and flexibility for Neogen Corporation (NEOG).
Key Features
- Comprehensive DCF Calculator: Features detailed unlevered and levered DCF valuation models tailored for Neogen Corporation (NEOG).
- WACC Calculator: Comes with a pre-built Weighted Average Cost of Capital sheet that allows for customizable inputs.
- Customizable Forecast Assumptions: Adjust growth rates, capital expenditures, and discount rates to fit your analysis.
- Integrated Financial Ratios: Evaluate profitability, leverage, and efficiency ratios specific to Neogen Corporation (NEOG).
- Interactive Dashboard and Charts: Visual representations summarize essential valuation metrics for straightforward analysis.
How It Works
- Download the Template: Gain immediate access to the Excel-based NEOG DCF Calculator.
- Input Your Assumptions: Modify the yellow-highlighted cells for growth rates, WACC, margins, and other parameters.
- Instant Calculations: The model automatically recalculates Neogen Corporation’s intrinsic value.
- Test Scenarios: Experiment with various assumptions to assess potential changes in valuation.
- Analyze and Decide: Utilize the findings to inform your investment or financial analysis.
Why Choose This Calculator for Neogen Corporation (NEOG)?
- User-Friendly Interface: Perfect for both novices and seasoned users.
- Customizable Inputs: Tailor assumptions easily to suit your financial analysis.
- Real-Time Feedback: Observe immediate updates to Neogen's valuation as you change the inputs.
- Pre-Loaded Data: Comes with Neogen’s latest financial information for swift evaluations.
- Relied Upon by Experts: A go-to tool for investors and analysts seeking reliable insights.
Who Should Use This Product?
- Investors: Evaluate Neogen Corporation’s (NEOG) valuation prior to making investment decisions.
- CFOs and Financial Analysts: Optimize valuation methodologies and validate forecasts for Neogen Corporation (NEOG).
- Startup Founders: Gain insights into how established companies like Neogen Corporation (NEOG) are valued in the market.
- Consultants: Produce comprehensive valuation reports for clients focused on Neogen Corporation (NEOG).
- Students and Educators: Utilize real-time data from Neogen Corporation (NEOG) to practice and instruct on valuation methods.
What the Template Contains
- Historical Data: Includes Neogen Corporation’s past financials and baseline forecasts.
- DCF and Levered DCF Models: Detailed templates to calculate Neogen Corporation’s intrinsic value.
- WACC Sheet: Pre-built calculations for Weighted Average Cost of Capital.
- Editable Inputs: Modify key drivers like growth rates, EBITDA %, and CAPEX assumptions.
- Quarterly and Annual Statements: A complete breakdown of Neogen Corporation’s financials.
- Interactive Dashboard: Visualize valuation results and projections dynamically.
Disclaimer
All information, articles, and product details provided on this website are for general informational and educational purposes only. We do not claim any ownership over, nor do we intend to infringe upon, any trademarks, copyrights, logos, brand names, or other intellectual property mentioned or depicted on this site. Such intellectual property remains the property of its respective owners, and any references here are made solely for identification or informational purposes, without implying any affiliation, endorsement, or partnership.
We make no representations or warranties, express or implied, regarding the accuracy, completeness, or suitability of any content or products presented. Nothing on this website should be construed as legal, tax, investment, financial, medical, or other professional advice. In addition, no part of this site—including articles or product references—constitutes a solicitation, recommendation, endorsement, advertisement, or offer to buy or sell any securities, franchises, or other financial instruments, particularly in jurisdictions where such activity would be unlawful.
All content is of a general nature and may not address the specific circumstances of any individual or entity. It is not a substitute for professional advice or services. Any actions you take based on the information provided here are strictly at your own risk. You accept full responsibility for any decisions or outcomes arising from your use of this website and agree to release us from any liability in connection with your use of, or reliance upon, the content or products found herein.