
|
NEPHROS, Inc. (NEPH) Évaluation DCF |
Entièrement Modifiable: Adapté À Vos Besoins Dans Excel Ou Sheets
Conception Professionnelle: Modèles Fiables Et Conformes Aux Normes Du Secteur
Pré-Construits Pour Une Utilisation Rapide Et Efficace
Compatible MAC/PC, entièrement débloqué
Aucune Expertise N'Est Requise; Facile À Suivre
Nephros, Inc. (NEPH) Bundle
Simplifiez l'évaluation Nephros, Inc. (NEPH) avec cette calculatrice DCF personnalisable! Doté de Real Nephros, Inc. (NEPH) Financials and Adjustable Prévision des entrées, vous pouvez tester les scénarios et découvrir la juste valeur de Nephros, Inc. (NEPH) en minutes.
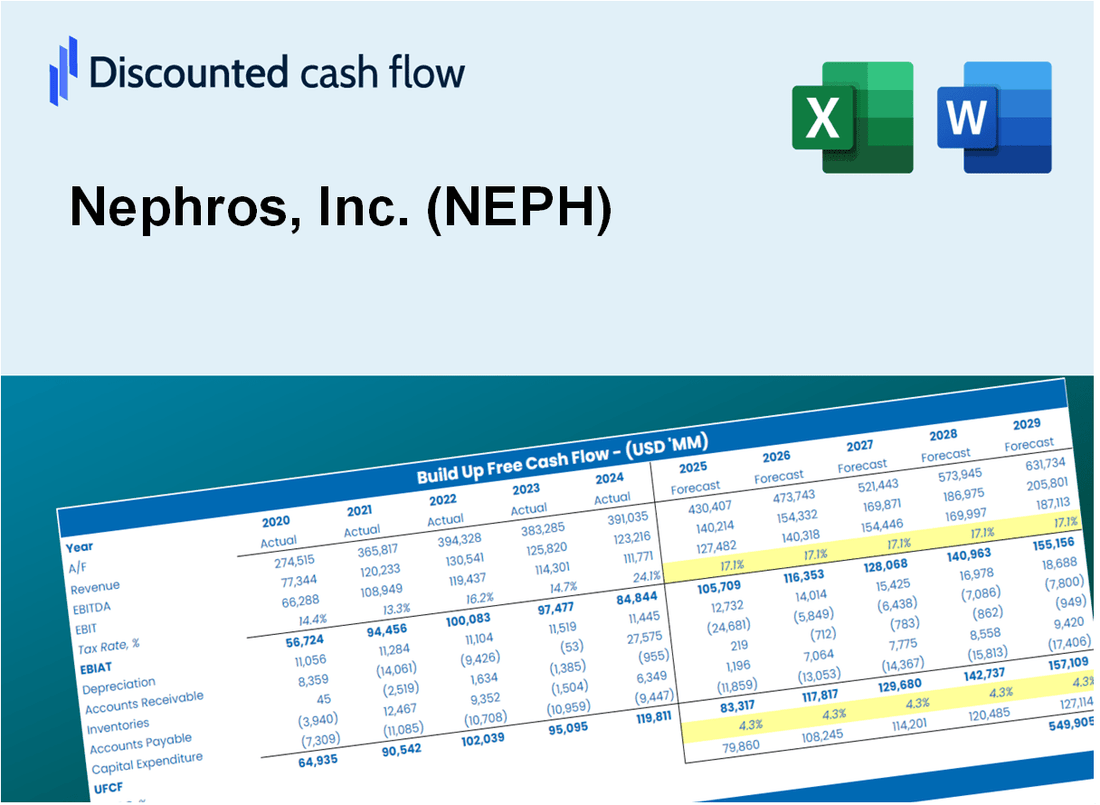
Discounted Cash Flow (DCF) - (USD MM)
| Year | AY1 2020 |
AY2 2021 |
AY3 2022 |
AY4 2023 |
AY5 2024 |
FY1 2025 |
FY2 2026 |
FY3 2027 |
FY4 2028 |
FY5 2029 |
|---|---|---|---|---|---|---|---|---|---|---|
| Revenue | 8.6 | 10.2 | 10.0 | 14.2 | 14.2 | 16.3 | 18.7 | 21.4 | 24.6 | 28.2 |
| Revenue Growth, % | 0 | 19.34 | -2.37 | 42.74 | -0.53378 | 14.79 | 14.79 | 14.79 | 14.79 | 14.79 |
| EBITDA | -4.2 | -2.5 | -3.7 | -1.4 | .2 | -3.9 | -4.4 | -5.1 | -5.8 | -6.7 |
| EBITDA, % | -49.15 | -24.38 | -36.95 | -9.54 | 1.6 | -23.69 | -23.69 | -23.69 | -23.69 | -23.69 |
| Depreciation | .2 | .3 | .6 | .2 | .1 | .4 | .5 | .6 | .6 | .7 |
| Depreciation, % | 2.43 | 2.47 | 5.72 | 1.5 | 0.96738 | 2.62 | 2.62 | 2.62 | 2.62 | 2.62 |
| EBIT | -4.4 | -2.7 | -4.3 | -1.6 | .1 | -4.3 | -4.9 | -5.6 | -6.5 | -7.4 |
| EBIT, % | -51.58 | -26.85 | -42.68 | -11.05 | 0.6355 | -26.3 | -26.3 | -26.3 | -26.3 | -26.3 |
| Total Cash | 8.2 | 7.0 | 3.6 | 4.3 | 3.8 | 8.4 | 9.6 | 11.0 | 12.7 | 14.6 |
| Total Cash, percent | .0 | .0 | .0 | .0 | .0 | .0 | .0 | .0 | .0 | .0 |
| Account Receivables | 1.4 | 1.6 | 1.3 | 1.5 | 1.8 | 2.2 | 2.5 | 2.9 | 3.3 | 3.8 |
| Account Receivables, % | 15.93 | 16.06 | 12.89 | 10.51 | 12.58 | 13.59 | 13.59 | 13.59 | 13.59 | 13.59 |
| Inventories | 5.3 | 4.5 | 3.2 | 2.5 | 2.6 | 5.6 | 6.5 | 7.4 | 8.5 | 9.8 |
| Inventories, % | 61.96 | 43.67 | 31.61 | 17.35 | 18.46 | 34.61 | 34.61 | 34.61 | 34.61 | 34.61 |
| Accounts Payable | .4 | 1.3 | .7 | .9 | .6 | 1.2 | 1.3 | 1.5 | 1.8 | 2.0 |
| Accounts Payable, % | 4.94 | 13.06 | 7.42 | 6.13 | 4.58 | 7.23 | 7.23 | 7.23 | 7.23 | 7.23 |
| Capital Expenditure | -.2 | .0 | -.1 | -.1 | -.1 | -.2 | -.2 | -.2 | -.3 | -.3 |
| Capital Expenditure, % | -2.79 | -0.35235 | -1.37 | -0.52676 | -0.38836 | -1.09 | -1.09 | -1.09 | -1.09 | -1.09 |
| Tax Rate, % | 16.85 | 16.85 | 16.85 | 16.85 | 16.85 | 16.85 | 16.85 | 16.85 | 16.85 | 16.85 |
| EBITAT | -4.7 | -4.0 | -7.3 | -1.6 | .1 | -4.1 | -4.7 | -5.4 | -6.3 | -7.2 |
| Depreciation | ||||||||||
| Changes in Account Receivables | ||||||||||
| Changes in Inventories | ||||||||||
| Changes in Accounts Payable | ||||||||||
| Capital Expenditure | ||||||||||
| UFCF | -10.9 | -2.4 | -5.8 | -.8 | -.5 | -6.8 | -5.4 | -6.2 | -7.2 | -8.2 |
| WACC, % | 10.49 | 10.49 | 10.49 | 10.49 | 10.47 | 10.48 | 10.48 | 10.48 | 10.48 | 10.48 |
| PV UFCF | ||||||||||
| SUM PV UFCF | -25.1 | |||||||||
| Long Term Growth Rate, % | 2.00 | |||||||||
| Free cash flow (T + 1) | -8 | |||||||||
| Terminal Value | -99 | |||||||||
| Present Terminal Value | -60 | |||||||||
| Enterprise Value | -85 | |||||||||
| Net Debt | -2 | |||||||||
| Equity Value | -83 | |||||||||
| Diluted Shares Outstanding, MM | 11 | |||||||||
| Equity Value Per Share | -7.81 |
What You Will Get
- Comprehensive NEPH Financials: Access to historical and forecasted data for precise valuation.
- Customizable Inputs: Adjust WACC, tax rates, revenue growth, and capital expenditures to fit your analysis.
- Dynamic Calculations: Intrinsic value and NPV are computed in real-time.
- Scenario Analysis: Explore various scenarios to assess Nephros, Inc.'s future performance.
- User-Friendly Interface: Designed for industry professionals while remaining accessible to newcomers.
Key Features
- Customizable Financial Inputs: Adjust essential metrics such as revenue projections, profit margins, and operational costs.
- Instant DCF Analysis: Automatically computes intrinsic value, net present value, and additional financial metrics.
- High-Precision Valuation: Incorporates Nephros, Inc.'s (NEPH) actual financial data for accurate valuation results.
- Simplified Scenario Testing: Easily evaluate various scenarios and analyze their potential impacts.
- Efficiency Booster: Avoid the hassle of constructing intricate valuation models from the ground up.
How It Works
- 1. Access the Template: Download and open the Excel file containing Nephros, Inc. (NEPH) preloaded data.
- 2. Modify Assumptions: Adjust key inputs such as growth rates, WACC, and capital expenditures specific to Nephros, Inc. (NEPH).
- 3. View Results Instantly: The DCF model automatically calculates the intrinsic value and NPV for Nephros, Inc. (NEPH).
- 4. Explore Scenarios: Evaluate various forecasts to assess different valuation outcomes for Nephros, Inc. (NEPH).
- 5. Present with Assurance: Deliver professional valuation insights to bolster your decision-making for Nephros, Inc. (NEPH).
Why Choose This Calculator for Nephros, Inc. (NEPH)?
- Designed for Experts: A sophisticated tool utilized by financial analysts, investment managers, and industry consultants.
- Accurate Data: Nephros’ historical and projected financials are preloaded for precise calculations.
- Flexible Scenario Analysis: Effortlessly simulate various forecasts and assumptions.
- Comprehensive Outputs: Automatically computes intrinsic value, NPV, and essential financial metrics.
- User-Friendly: Step-by-step guidance ensures a smooth calculation experience.
Who Should Use This Product?
- Healthcare Investors: Develop comprehensive and accurate valuation models for analyzing Nephros, Inc. (NEPH).
- Corporate Finance Teams: Evaluate valuation scenarios to inform strategic decisions within the healthcare sector.
- Consultants and Advisors: Offer clients precise valuation insights for Nephros, Inc. (NEPH) investments.
- Students and Educators: Utilize real-world data to learn and teach financial modeling in the healthcare industry.
- Medical Technology Enthusiasts: Gain insights into how companies like Nephros, Inc. (NEPH) are valued in the market.
What the Template Contains
- Pre-Filled DCF Model: Nephros, Inc.'s (NEPH) financial data preloaded for immediate use.
- WACC Calculator: Detailed calculations for Weighted Average Cost of Capital.
- Financial Ratios: Evaluate Nephros, Inc.'s (NEPH) profitability, leverage, and efficiency.
- Editable Inputs: Change assumptions such as growth, margins, and CAPEX to fit your scenarios.
- Financial Statements: Annual and quarterly reports to support detailed analysis.
- Interactive Dashboard: Easily visualize key valuation metrics and results.
Disclaimer
All information, articles, and product details provided on this website are for general informational and educational purposes only. We do not claim any ownership over, nor do we intend to infringe upon, any trademarks, copyrights, logos, brand names, or other intellectual property mentioned or depicted on this site. Such intellectual property remains the property of its respective owners, and any references here are made solely for identification or informational purposes, without implying any affiliation, endorsement, or partnership.
We make no representations or warranties, express or implied, regarding the accuracy, completeness, or suitability of any content or products presented. Nothing on this website should be construed as legal, tax, investment, financial, medical, or other professional advice. In addition, no part of this site—including articles or product references—constitutes a solicitation, recommendation, endorsement, advertisement, or offer to buy or sell any securities, franchises, or other financial instruments, particularly in jurisdictions where such activity would be unlawful.
All content is of a general nature and may not address the specific circumstances of any individual or entity. It is not a substitute for professional advice or services. Any actions you take based on the information provided here are strictly at your own risk. You accept full responsibility for any decisions or outcomes arising from your use of this website and agree to release us from any liability in connection with your use of, or reliance upon, the content or products found herein.