
|
National Energy Services Renumed Corp (NESRW) Évaluation DCF |
Entièrement Modifiable: Adapté À Vos Besoins Dans Excel Ou Sheets
Conception Professionnelle: Modèles Fiables Et Conformes Aux Normes Du Secteur
Pré-Construits Pour Une Utilisation Rapide Et Efficace
Compatible MAC/PC, entièrement débloqué
Aucune Expertise N'Est Requise; Facile À Suivre
National Energy Services Reunited Corp (NESRW) Bundle
Découvrez le véritable potentiel de National Energy Services Renouted Corp (NESRW) avec notre calculatrice avancée DCF! Ajustez les hypothèses clés, explorez divers scénarios et évaluez comment les changements affectent l'évaluation de National Energy Services Renouted Corp (NESRW) - tous commodément dans un seul modèle Excel.
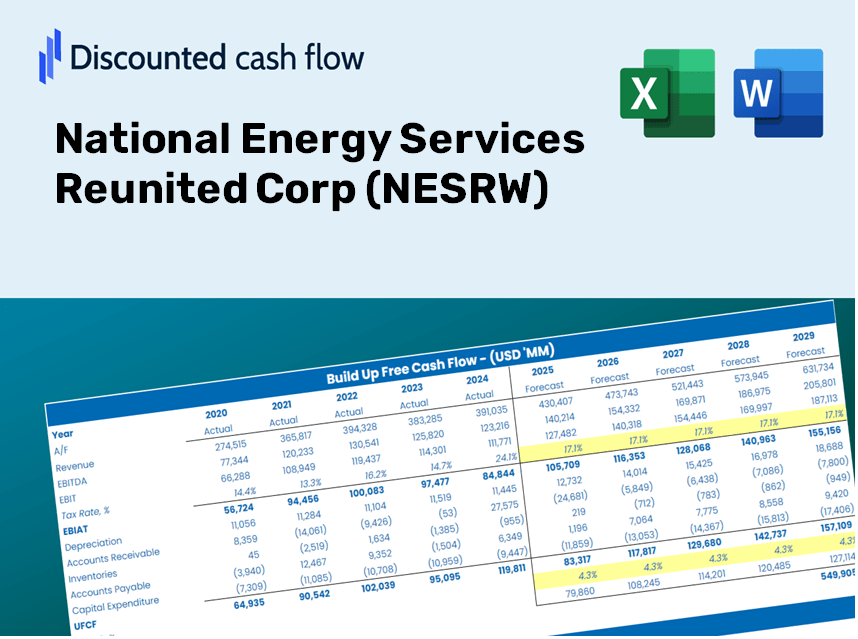
Discounted Cash Flow (DCF) - (USD MM)
| Year | AY1 2020 |
AY2 2021 |
AY3 2022 |
AY4 2023 |
AY5 2024 |
FY1 2025 |
FY2 2026 |
FY3 2027 |
FY4 2028 |
FY5 2029 |
|---|---|---|---|---|---|---|---|---|---|---|
| Revenue | 834.2 | 876.7 | 909.5 | 1,145.9 | 1,301.7 | 1,459.3 | 1,636.0 | 1,834.1 | 2,056.1 | 2,305.1 |
| Revenue Growth, % | 0 | 5.1 | 3.74 | 25.99 | 13.6 | 12.11 | 12.11 | 12.11 | 12.11 | 12.11 |
| EBITDA | 165.7 | 76.7 | 120.2 | 217.9 | 278.2 | 239.9 | 269.0 | 301.6 | 338.1 | 379.0 |
| EBITDA, % | 19.86 | 8.75 | 13.21 | 19.02 | 21.37 | 16.44 | 16.44 | 16.44 | 16.44 | 16.44 |
| Depreciation | 120.7 | 122.1 | 115.8 | 142.2 | 142.8 | 188.3 | 211.1 | 236.7 | 265.3 | 297.5 |
| Depreciation, % | 14.47 | 13.93 | 12.74 | 12.41 | 10.97 | 12.9 | 12.9 | 12.9 | 12.9 | 12.9 |
| EBIT | 45.0 | -45.4 | 4.3 | 75.7 | 135.4 | 51.6 | 57.9 | 64.9 | 72.8 | 81.6 |
| EBIT, % | 5.39 | -5.18 | 0.47553 | 6.6 | 10.4 | 3.54 | 3.54 | 3.54 | 3.54 | 3.54 |
| Total Cash | 75.0 | 205.8 | 78.9 | 67.8 | 108.0 | 161.5 | 181.1 | 203.0 | 227.6 | 255.2 |
| Total Cash, percent | .0 | .0 | .0 | .0 | .0 | .0 | .0 | .0 | .0 | .0 |
| Account Receivables | 330.5 | 315.3 | 331.4 | 355.5 | 318.5 | 488.9 | 548.1 | 614.5 | 688.9 | 772.3 |
| Account Receivables, % | 39.62 | 35.96 | 36.44 | 31.02 | 24.47 | 33.5 | 33.5 | 33.5 | 33.5 | 33.5 |
| Inventories | 94.3 | 93.9 | 110.5 | 98.4 | 96.8 | 146.5 | 164.2 | 184.1 | 206.4 | 231.4 |
| Inventories, % | 11.3 | 10.71 | 12.15 | 8.59 | 7.43 | 10.04 | 10.04 | 10.04 | 10.04 | 10.04 |
| Accounts Payable | 144.6 | 314.6 | 353.5 | 351.2 | 305.3 | 426.7 | 478.3 | 536.3 | 601.2 | 674.0 |
| Accounts Payable, % | 17.34 | 35.88 | 38.87 | 30.65 | 23.45 | 29.24 | 29.24 | 29.24 | 29.24 | 29.24 |
| Capital Expenditure | -82.6 | -107.1 | -122.4 | -68.2 | -105.1 | -144.8 | -162.3 | -182.0 | -204.0 | -228.7 |
| Capital Expenditure, % | -9.91 | -12.21 | -13.46 | -5.95 | -8.07 | -9.92 | -9.92 | -9.92 | -9.92 | -9.92 |
| Tax Rate, % | 20.09 | 20.09 | 20.09 | 20.09 | 20.09 | 20.09 | 20.09 | 20.09 | 20.09 | 20.09 |
| EBITAT | 25.6 | -48.4 | 5.3 | 31.9 | 108.2 | 39.1 | 43.9 | 49.2 | 55.1 | 61.8 |
| Depreciation | ||||||||||
| Changes in Account Receivables | ||||||||||
| Changes in Inventories | ||||||||||
| Changes in Accounts Payable | ||||||||||
| Capital Expenditure | ||||||||||
| UFCF | -216.5 | 152.3 | 4.8 | 91.7 | 138.5 | -16.0 | 67.4 | 75.6 | 84.7 | 95.0 |
| WACC, % | 5.32 | 6.53 | 6.53 | 4.9 | 5.97 | 5.85 | 5.85 | 5.85 | 5.85 | 5.85 |
| PV UFCF | ||||||||||
| SUM PV UFCF | 247.7 | |||||||||
| Long Term Growth Rate, % | 4.00 | |||||||||
| Free cash flow (T + 1) | 99 | |||||||||
| Terminal Value | 5,338 | |||||||||
| Present Terminal Value | 4,017 | |||||||||
| Enterprise Value | 4,265 | |||||||||
| Net Debt | 301 | |||||||||
| Equity Value | 3,963 | |||||||||
| Diluted Shares Outstanding, MM | 96 | |||||||||
| Equity Value Per Share | 41.44 |
Benefits You Will Receive
- Pre-Loaded Financial Model: Utilizing National Energy Services Reunited Corp (NESRW)'s actual figures for accurate DCF valuation.
- Comprehensive Forecast Management: Modify revenue growth, profit margins, WACC, and other essential factors.
- Real-Time Calculations: Instantaneous updates allow you to view results as adjustments are made.
- Professional-Grade Template: A polished Excel file crafted for high-quality financial analysis.
- Flexible and Reusable: Designed for adaptability, enabling multiple uses for in-depth forecasting.
Key Features
- Customizable Forecast Inputs: Adjust essential metrics such as revenue growth, EBITDA margins, and capital expenditures.
- Instant DCF Valuation: Quickly determines intrinsic value, NPV, and additional financial outputs.
- High-Precision Accuracy: Leverages real-world financial data from National Energy Services Reunited Corp (NESRW) for credible valuation results.
- Effortless Scenario Analysis: Easily assess various assumptions and compare resulting outcomes.
- Efficiency-Boosting Tool: Avoid the complexities of developing intricate valuation models from the ground up.
How It Works
- Step 1: Download the prebuilt Excel template featuring data for National Energy Services Reunited Corp (NESRW).
- Step 2: Familiarize yourself with the pre-filled sheets and key performance indicators.
- Step 3: Revise forecasts and assumptions in the editable yellow cells (WACC, growth, margins).
- Step 4: View the updated results immediately, including the intrinsic value of National Energy Services Reunited Corp (NESRW).
- Step 5: Utilize the outputs to make well-informed investment decisions or create detailed reports.
Why Choose This Calculator for National Energy Services Reunited Corp (NESRW)?
- User-Friendly and Accessible: Suitable for both novices and experienced users.
- Customizable Inputs: Effortlessly adjust parameters to suit your analytical needs.
- Real-Time Feedback: Observe immediate changes in the valuation of NESRW as you tweak inputs.
- Preconfigured and Ready: Comes with NESRW's current financial data for swift evaluations.
- Relied Upon by Experts: Favored by investors and analysts for well-informed decision-making.
Who Can Benefit from NESRW's Offerings?
- Investors: Gain the confidence to make informed decisions with our expert-level valuation tools.
- Financial Analysts: Enhance efficiency with our customizable, pre-designed DCF models.
- Consultants: Effortlessly modify templates for client presentations or detailed reports.
- Finance Enthusiasts: Expand your knowledge of valuation methods through practical, real-world examples.
- Educators and Students: Utilize our resources as effective teaching tools in finance-related coursework.
Contents of the Template
- Preloaded NESRW Data: Historical and projected financial metrics, encompassing revenue, EBIT, and capital expenditures.
- DCF and WACC Models: Advanced spreadsheets designed for estimating intrinsic value and Weighted Average Cost of Capital.
- Editable Inputs: Yellow-highlighted fields for modifying revenue growth rates, tax percentages, and discount rates.
- Financial Statements: Detailed annual and quarterly financial reports for extensive analysis.
- Key Ratios: Profitability, leverage, and efficiency ratios for performance assessment.
- Dashboard and Charts: Visual representations of valuation results and underlying assumptions.
Disclaimer
All information, articles, and product details provided on this website are for general informational and educational purposes only. We do not claim any ownership over, nor do we intend to infringe upon, any trademarks, copyrights, logos, brand names, or other intellectual property mentioned or depicted on this site. Such intellectual property remains the property of its respective owners, and any references here are made solely for identification or informational purposes, without implying any affiliation, endorsement, or partnership.
We make no representations or warranties, express or implied, regarding the accuracy, completeness, or suitability of any content or products presented. Nothing on this website should be construed as legal, tax, investment, financial, medical, or other professional advice. In addition, no part of this site—including articles or product references—constitutes a solicitation, recommendation, endorsement, advertisement, or offer to buy or sell any securities, franchises, or other financial instruments, particularly in jurisdictions where such activity would be unlawful.
All content is of a general nature and may not address the specific circumstances of any individual or entity. It is not a substitute for professional advice or services. Any actions you take based on the information provided here are strictly at your own risk. You accept full responsibility for any decisions or outcomes arising from your use of this website and agree to release us from any liability in connection with your use of, or reliance upon, the content or products found herein.