
|
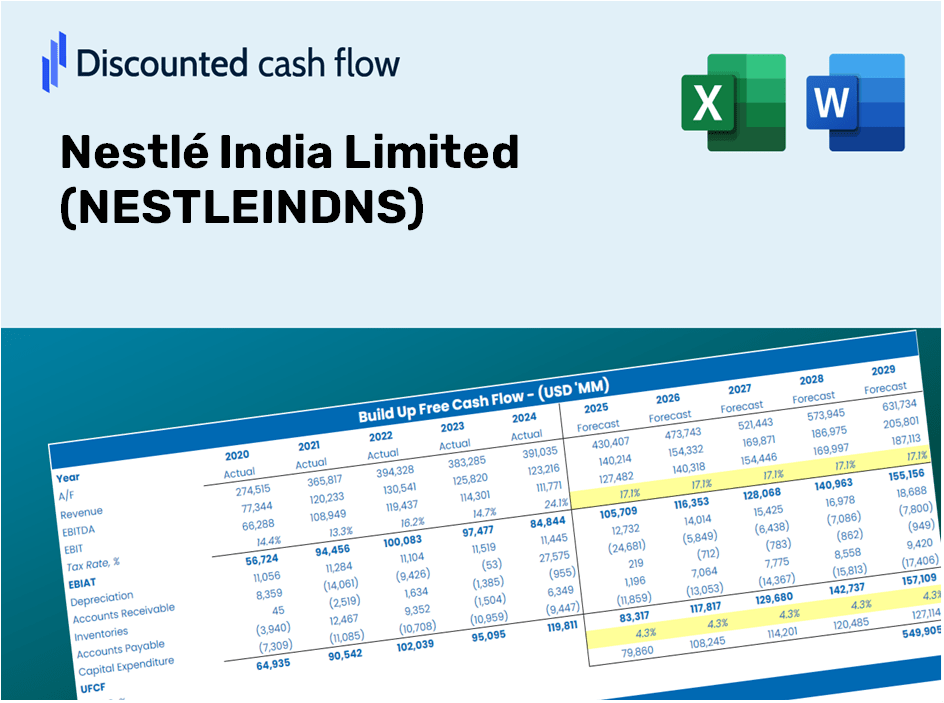
Nestlé India Limited (Nestleind.NS) Valeure DCF |
Entièrement Modifiable: Adapté À Vos Besoins Dans Excel Ou Sheets
Conception Professionnelle: Modèles Fiables Et Conformes Aux Normes Du Secteur
Pré-Construits Pour Une Utilisation Rapide Et Efficace
Compatible MAC/PC, entièrement débloqué
Aucune Expertise N'Est Requise; Facile À Suivre
Nestlé India Limited (NESTLEIND.NS) Bundle
Améliorez vos stratégies d'investissement avec la calculatrice DCF de Nestlé India Limited (Nestleindns)! Examinez les finances authentiques de Nestlé Inde, modifiez les projections et dépenses de croissance et observez instantanément comment ces ajustements affectent la valeur intrinsèque de Nestlé India Limited (Nestleindns).
Discounted Cash Flow (DCF) - (USD MM)
| Year | AY1 2021 |
AY2 2022 |
AY3 2023 |
AY4 2024 |
AY5 2025 |
FY1 2026 |
FY2 2027 |
FY3 2028 |
FY4 2029 |
FY5 2030 |
|---|---|---|---|---|---|---|---|---|---|---|
| Revenue | 133,133.8 | 146,962.9 | 168,315.2 | 194,633.9 | 201,304.2 | 223,437.6 | 248,004.6 | 275,272.8 | 305,539.1 | 339,133.2 |
| Revenue Growth, % | 0 | 10.39 | 14.53 | 15.64 | 3.43 | 11 | 11 | 11 | 11 | 11 |
| EBITDA | 32,097.1 | 33,004.7 | 37,452.1 | 47,127.2 | 49,525.9 | 52,567.6 | 58,347.4 | 64,762.7 | 71,883.4 | 79,787.0 |
| EBITDA, % | 24.11 | 22.46 | 22.25 | 24.21 | 24.6 | 23.53 | 23.53 | 23.53 | 23.53 | 23.53 |
| Depreciation | 3,703.8 | 3,910.2 | 4,030.1 | 4,302.2 | 5,399.2 | 5,688.5 | 6,314.0 | 7,008.2 | 7,778.8 | 8,634.1 |
| Depreciation, % | 2.78 | 2.66 | 2.39 | 2.21 | 2.68 | 2.55 | 2.55 | 2.55 | 2.55 | 2.55 |
| EBIT | 28,393.3 | 29,094.5 | 33,422.0 | 42,825.0 | 44,126.7 | 46,879.0 | 52,033.4 | 57,754.5 | 64,104.6 | 71,152.9 |
| EBIT, % | 21.33 | 19.8 | 19.86 | 22 | 21.92 | 20.98 | 20.98 | 20.98 | 20.98 | 20.98 |
| Total Cash | 24,928.1 | 7,986.9 | 11,629.0 | 8,188.3 | 956.5 | 15,975.8 | 17,732.3 | 19,682.0 | 21,846.0 | 24,248.0 |
| Total Cash, percent | .0 | .0 | .0 | .0 | .0 | .0 | .0 | .0 | .0 | .0 |
| Account Receivables | 2,467.5 | 2,386.1 | 2,673.3 | 3,713.3 | 4,118.2 | 4,030.3 | 4,473.4 | 4,965.3 | 5,511.2 | 6,117.2 |
| Account Receivables, % | 1.85 | 1.62 | 1.59 | 1.91 | 2.05 | 1.8 | 1.8 | 1.8 | 1.8 | 1.8 |
| Inventories | 14,164.8 | 15,926.5 | 19,287.7 | 20,893.6 | 28,501.4 | 25,842.4 | 28,683.8 | 31,837.5 | 35,338.1 | 39,223.5 |
| Inventories, % | 10.64 | 10.84 | 11.46 | 10.73 | 14.16 | 11.57 | 11.57 | 11.57 | 11.57 | 11.57 |
| Accounts Payable | 15,166.7 | 17,481.7 | 19,367.1 | 22,381.2 | 23,738.9 | 25,957.0 | 28,811.0 | 31,978.7 | 35,494.8 | 39,397.4 |
| Accounts Payable, % | 11.39 | 11.9 | 11.51 | 11.5 | 11.79 | 11.62 | 11.62 | 11.62 | 11.62 | 11.62 |
| Capital Expenditure | -4,783.6 | -7,348.4 | -5,499.2 | -18,826.7 | -20,086.4 | -14,081.7 | -15,630.0 | -17,348.5 | -19,256.0 | -21,373.2 |
| Capital Expenditure, % | -3.59 | -5 | -3.27 | -9.67 | -9.98 | -6.3 | -6.3 | -6.3 | -6.3 | -6.3 |
| Tax Rate, % | 25.68 | 25.68 | 25.68 | 25.68 | 25.68 | 25.68 | 25.68 | 25.68 | 25.68 | 25.68 |
| EBITAT | 21,020.8 | 21,570.6 | 24,538.3 | 32,350.3 | 32,793.4 | 34,826.5 | 38,655.7 | 42,905.9 | 47,623.4 | 52,859.6 |
| Depreciation | ||||||||||
| Changes in Account Receivables | ||||||||||
| Changes in Inventories | ||||||||||
| Changes in Accounts Payable | ||||||||||
| Capital Expenditure | ||||||||||
| UFCF | 18,475.4 | 18,767.1 | 21,306.2 | 18,194.0 | 11,451.2 | 31,398.4 | 28,909.2 | 32,087.8 | 35,615.8 | 39,531.8 |
| WACC, % | 4.82 | 4.82 | 4.82 | 4.82 | 4.82 | 4.82 | 4.82 | 4.82 | 4.82 | 4.82 |
| PV UFCF | ||||||||||
| SUM PV UFCF | 144,858.1 | |||||||||
| Long Term Growth Rate, % | 4.00 | |||||||||
| Free cash flow (T + 1) | 41,113 | |||||||||
| Terminal Value | 4,993,767 | |||||||||
| Present Terminal Value | 3,945,839 | |||||||||
| Enterprise Value | 4,090,697 | |||||||||
| Net Debt | 10,712 | |||||||||
| Equity Value | 4,079,985 | |||||||||
| Diluted Shares Outstanding, MM | 1,928 | |||||||||
| Equity Value Per Share | 2,115.83 |
What You Will Receive
- Customizable Excel Template: An adjustable Excel-based DCF Calculator featuring pre-filled financial data for Nestlé India Limited (NESTLEINDNS).
- Accurate Market Data: Access to historical performance data and projections (highlighted in the yellow cells).
- Flexible Forecasting: Modify assumptions such as revenue growth, EBITDA %, and WACC to suit your analysis.
- Instant Calculations: Quickly see how your inputs affect the valuation of Nestlé India Limited (NESTLEINDNS).
- Professional-Grade Tool: Designed specifically for investors, CFOs, consultants, and financial analysts.
- Intuitive Layout: Organized for simplicity and ease of navigation, complete with step-by-step guidance.
Key Features
- Comprehensive DCF Calculator: Offers in-depth unlevered and levered DCF valuation models tailored for Nestlé India Limited (NESTLEINDNS).
- WACC Calculator: Comes with a pre-configured Weighted Average Cost of Capital sheet that allows for customizable inputs specific to Nestlé India Limited.
- Adjustable Forecast Assumptions: Easily alter growth rates, capital expenditures, and discount rates to fit Nestlé India Limited’s needs.
- Integrated Financial Ratios: Evaluate profitability, leverage, and efficiency ratios pertinent to Nestlé India Limited (NESTLEINDNS).
- Interactive Dashboard and Charts: Visual representations of key valuation metrics for straightforward analysis of Nestlé India Limited.
How It Works
- 1. Access the Template: Download and open the Excel file containing Nestlé India Limited's preloaded data.
- 2. Modify Assumptions: Adjust key inputs such as growth projections, WACC, and capital expenditures.
- 3. View Results Instantly: The DCF model automatically calculates the intrinsic value and NPV.
- 4. Explore Scenarios: Evaluate multiple forecasts to assess different valuation possibilities.
- 5. Utilize with Confidence: Share professional valuation insights to inform your decision-making.
Why Choose This Calculator for Nestlé India Limited (NESTLEINDNS)?
- Accuracy: Utilizes authentic Nestlé India financial data to ensure precision.
- Flexibility: Built to allow users to easily modify and test various inputs.
- Time-Efficient: Eliminate the need to construct a discounted cash flow model from the ground up.
- Professional Quality: Crafted with the expertise and usability standards expected by CFOs.
- Intuitive Design: Simple to navigate, even for those without a background in financial modeling.
Who Should Utilize This Product?
- Investors: Evaluate Nestlé India Limited’s (NESTLEINDNS) valuation prior to making investment decisions.
- CFOs and Financial Analysts: Optimize valuation workflows and assess financial forecasts.
- Startup Founders: Understand the valuation methodologies applied to established companies like Nestlé India Limited.
- Consultants: Provide comprehensive valuation reports for client engagements.
- Students and Educators: Utilize real-world examples to learn and teach valuation strategies.
What the Template Contains
- Preloaded NESTLEINDNS Data: Historical and projected financial metrics, including revenue, EBIT, and capital expenditures.
- DCF and WACC Models: Advanced spreadsheets designed for calculating intrinsic value and Weighted Average Cost of Capital.
- Editable Inputs: Yellow-highlighted cells for modifying revenue growth, tax rates, and discount rates.
- Financial Statements: Detailed annual and quarterly financial reports for in-depth analysis.
- Key Ratios: Profitability, leverage, and efficiency ratios to assess overall performance.
- Dashboard and Charts: Visual representations of valuation results and underlying assumptions.
Disclaimer
All information, articles, and product details provided on this website are for general informational and educational purposes only. We do not claim any ownership over, nor do we intend to infringe upon, any trademarks, copyrights, logos, brand names, or other intellectual property mentioned or depicted on this site. Such intellectual property remains the property of its respective owners, and any references here are made solely for identification or informational purposes, without implying any affiliation, endorsement, or partnership.
We make no representations or warranties, express or implied, regarding the accuracy, completeness, or suitability of any content or products presented. Nothing on this website should be construed as legal, tax, investment, financial, medical, or other professional advice. In addition, no part of this site—including articles or product references—constitutes a solicitation, recommendation, endorsement, advertisement, or offer to buy or sell any securities, franchises, or other financial instruments, particularly in jurisdictions where such activity would be unlawful.
All content is of a general nature and may not address the specific circumstances of any individual or entity. It is not a substitute for professional advice or services. Any actions you take based on the information provided here are strictly at your own risk. You accept full responsibility for any decisions or outcomes arising from your use of this website and agree to release us from any liability in connection with your use of, or reliance upon, the content or products found herein.