
|
New Fortress Energy Inc. (NFE) Évaluation DCF |
Entièrement Modifiable: Adapté À Vos Besoins Dans Excel Ou Sheets
Conception Professionnelle: Modèles Fiables Et Conformes Aux Normes Du Secteur
Pré-Construits Pour Une Utilisation Rapide Et Efficace
Compatible MAC/PC, entièrement débloqué
Aucune Expertise N'Est Requise; Facile À Suivre
New Fortress Energy Inc. (NFE) Bundle
Découvrez le véritable potentiel de New Fortress Energy Inc. (NFE) avec notre calculatrice DCF de qualité professionnelle! Ajustez les hypothèses clés, explorez divers scénarios et examinez comment les changements affectent la nouvelle évaluation de Fortress Energy Inc. (NFE) - tout dans un modèle Excel pratique.
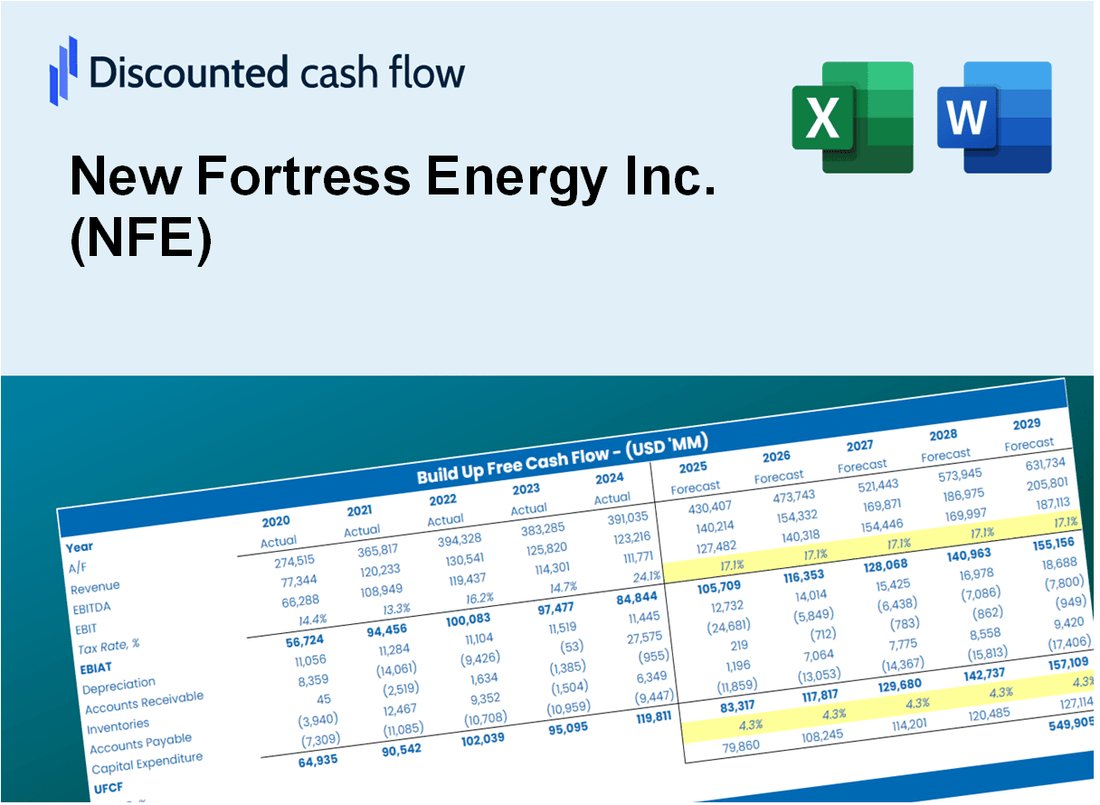
Discounted Cash Flow (DCF) - (USD MM)
| Year | AY1 2020 |
AY2 2021 |
AY3 2022 |
AY4 2023 |
AY5 2024 |
FY1 2025 |
FY2 2026 |
FY3 2027 |
FY4 2028 |
FY5 2029 |
|---|---|---|---|---|---|---|---|---|---|---|
| Revenue | 451.7 | 1,322.8 | 2,368.3 | 2,413.3 | 2,364.9 | 3,422.7 | 4,953.7 | 7,169.7 | 10,376.8 | 15,018.5 |
| Revenue Growth, % | 0 | 192.88 | 79.03 | 1.9 | -2.01 | 44.73 | 44.73 | 44.73 | 44.73 | 44.73 |
| EBITDA | -175.7 | 350.5 | 440.8 | 1,111.0 | 317.5 | 449.6 | 650.7 | 941.8 | 1,363.0 | 1,972.7 |
| EBITDA, % | -38.89 | 26.49 | 18.61 | 46.04 | 13.43 | 13.14 | 13.14 | 13.14 | 13.14 | 13.14 |
| Depreciation | 33.2 | 99.5 | 142.6 | 187.3 | 162.5 | 243.3 | 352.1 | 509.6 | 737.6 | 1,067.6 |
| Depreciation, % | 7.36 | 7.53 | 6.02 | 7.76 | 6.87 | 7.11 | 7.11 | 7.11 | 7.11 | 7.11 |
| EBIT | -208.9 | 250.9 | 298.2 | 923.7 | 155.0 | 206.3 | 298.6 | 432.1 | 625.4 | 905.2 |
| EBIT, % | -46.25 | 18.97 | 12.59 | 38.27 | 6.55 | 6.03 | 6.03 | 6.03 | 6.03 | 6.03 |
| Total Cash | 601.5 | 187.5 | 675.5 | 155.4 | 492.9 | 1,163.6 | 1,684.1 | 2,437.4 | 3,527.7 | 5,105.7 |
| Total Cash, percent | .0 | .0 | .0 | .0 | .0 | .0 | .0 | .0 | .0 | .0 |
| Account Receivables | 80.6 | 244.9 | 318.5 | 424.6 | 481.4 | 600.7 | 869.4 | 1,258.3 | 1,821.1 | 2,635.7 |
| Account Receivables, % | 17.84 | 18.51 | 13.45 | 17.59 | 20.36 | 17.55 | 17.55 | 17.55 | 17.55 | 17.55 |
| Inventories | 22.9 | .0 | 39.1 | 113.7 | 103.2 | 108.1 | 156.4 | 226.4 | 327.6 | 474.2 |
| Inventories, % | 5.06 | 0 | 1.65 | 4.71 | 4.36 | 3.16 | 3.16 | 3.16 | 3.16 | 3.16 |
| Accounts Payable | 21.3 | 68.1 | 80.4 | 549.5 | 473.7 | 383.8 | 555.5 | 803.9 | 1,163.6 | 1,684.0 |
| Accounts Payable, % | 4.72 | 5.15 | 3.39 | 22.77 | 20.03 | 11.21 | 11.21 | 11.21 | 11.21 | 11.21 |
| Capital Expenditure | -157.0 | -669.3 | -1,174.0 | -3,029.8 | -2,621.2 | -2,292.8 | -3,318.3 | -4,802.7 | -6,951.0 | -10,060.4 |
| Capital Expenditure, % | -34.76 | -50.6 | -49.57 | -125.55 | -110.84 | -66.99 | -66.99 | -66.99 | -66.99 | -66.99 |
| Tax Rate, % | -44.05 | -44.05 | -44.05 | -44.05 | -44.05 | -44.05 | -44.05 | -44.05 | -44.05 | -44.05 |
| EBITAT | -146.8 | 231.7 | 945.4 | 761.7 | 223.3 | 183.6 | 265.8 | 384.7 | 556.7 | 805.8 |
| Depreciation | ||||||||||
| Changes in Account Receivables | ||||||||||
| Changes in Inventories | ||||||||||
| Changes in Accounts Payable | ||||||||||
| Capital Expenditure | ||||||||||
| UFCF | -352.7 | -432.8 | -186.4 | -1,792.4 | -2,357.6 | -2,079.9 | -2,845.8 | -4,118.8 | -5,961.2 | -8,627.8 |
| WACC, % | 2.77 | 3.58 | 3.86 | 3.22 | 3.86 | 3.46 | 3.46 | 3.46 | 3.46 | 3.46 |
| PV UFCF | ||||||||||
| SUM PV UFCF | -20,870.3 | |||||||||
| Long Term Growth Rate, % | 2.00 | |||||||||
| Free cash flow (T + 1) | -8,800 | |||||||||
| Terminal Value | -603,238 | |||||||||
| Present Terminal Value | -508,921 | |||||||||
| Enterprise Value | -529,792 | |||||||||
| Net Debt | 9,005 | |||||||||
| Equity Value | -538,797 | |||||||||
| Diluted Shares Outstanding, MM | 219 | |||||||||
| Equity Value Per Share | -2,464.51 |
What You Will Get
- Real NFE Financial Data: Pre-filled with New Fortress Energy’s historical and projected data for precise analysis.
- Fully Editable Template: Modify key inputs like revenue growth, WACC, and EBITDA % with ease.
- Automatic Calculations: See New Fortress Energy’s intrinsic value update instantly based on your changes.
- Professional Valuation Tool: Designed for investors, analysts, and consultants seeking accurate DCF results.
- User-Friendly Design: Simple structure and clear instructions for all experience levels.
Key Features
- Comprehensive Financial Data: Access precise historical figures and future forecasts tailored for New Fortress Energy Inc. (NFE).
- Adjustable Forecast Parameters: Modify highlighted cells for key metrics such as WACC, growth rates, and profit margins.
- Real-Time Calculations: Automatic recalculations for DCF, Net Present Value (NPV), and cash flow assessments.
- Interactive Dashboard: User-friendly charts and summaries to effectively present your valuation findings.
- Suitable for All Levels: An intuitive layout designed for investors, CFOs, and consultants alike.
How It Works
- Step 1: Download the Excel file.
- Step 2: Review New Fortress Energy Inc.'s (NFE) pre-filled financial data and forecasts.
- Step 3: Modify key inputs such as revenue growth, WACC, and tax rates (highlighted cells).
- Step 4: Observe the DCF model update in real-time as you adjust your assumptions.
- Step 5: Analyze the outputs and leverage the results for your investment strategies.
Why Choose This Calculator for New Fortress Energy Inc. (NFE)?
- Accurate Data: Up-to-date New Fortress Energy financials provide trustworthy valuation outcomes.
- Customizable: Tailor essential parameters such as growth rates, WACC, and tax rates to fit your forecasts.
- Time-Saving: Pre-configured calculations save you the hassle of starting from scratch.
- Professional-Grade Tool: Crafted for investors, analysts, and consultants in the energy sector.
- User-Friendly: An intuitive design and clear instructions ensure ease of use for everyone.
Who Should Use New Fortress Energy Inc. (NFE)?
- Investors: Make informed decisions with a comprehensive analysis of energy market trends.
- Financial Analysts: Streamline your workflow with ready-to-use financial models tailored for the energy sector.
- Consultants: Easily customize reports and presentations for clients in the energy industry.
- Energy Enthusiasts: Enhance your knowledge of energy investments through practical case studies.
- Educators and Students: Utilize this resource as a hands-on learning tool in energy finance courses.
What the Template Contains
- Operating and Balance Sheet Data: Pre-filled New Fortress Energy Inc. (NFE) historical data and forecasts, including revenue, EBITDA, EBIT, and capital expenditures.
- WACC Calculation: A dedicated sheet for Weighted Average Cost of Capital (WACC), featuring parameters such as Beta, risk-free rate, and share price.
- DCF Valuation (Unlevered and Levered): Editable Discounted Cash Flow models that display intrinsic value with comprehensive calculations.
- Financial Statements: Pre-loaded financial statements (annual and quarterly) to facilitate analysis.
- Key Ratios: Includes profitability, leverage, and efficiency ratios for New Fortress Energy Inc. (NFE).
- Dashboard and Charts: Visual summary of valuation outputs and assumptions for easy analysis of results.
Disclaimer
All information, articles, and product details provided on this website are for general informational and educational purposes only. We do not claim any ownership over, nor do we intend to infringe upon, any trademarks, copyrights, logos, brand names, or other intellectual property mentioned or depicted on this site. Such intellectual property remains the property of its respective owners, and any references here are made solely for identification or informational purposes, without implying any affiliation, endorsement, or partnership.
We make no representations or warranties, express or implied, regarding the accuracy, completeness, or suitability of any content or products presented. Nothing on this website should be construed as legal, tax, investment, financial, medical, or other professional advice. In addition, no part of this site—including articles or product references—constitutes a solicitation, recommendation, endorsement, advertisement, or offer to buy or sell any securities, franchises, or other financial instruments, particularly in jurisdictions where such activity would be unlawful.
All content is of a general nature and may not address the specific circumstances of any individual or entity. It is not a substitute for professional advice or services. Any actions you take based on the information provided here are strictly at your own risk. You accept full responsibility for any decisions or outcomes arising from your use of this website and agree to release us from any liability in connection with your use of, or reliance upon, the content or products found herein.