
|
Navios Maritime Partners L.P. (NMM) Valation DCF |
Entièrement Modifiable: Adapté À Vos Besoins Dans Excel Ou Sheets
Conception Professionnelle: Modèles Fiables Et Conformes Aux Normes Du Secteur
Pré-Construits Pour Une Utilisation Rapide Et Efficace
Compatible MAC/PC, entièrement débloqué
Aucune Expertise N'Est Requise; Facile À Suivre
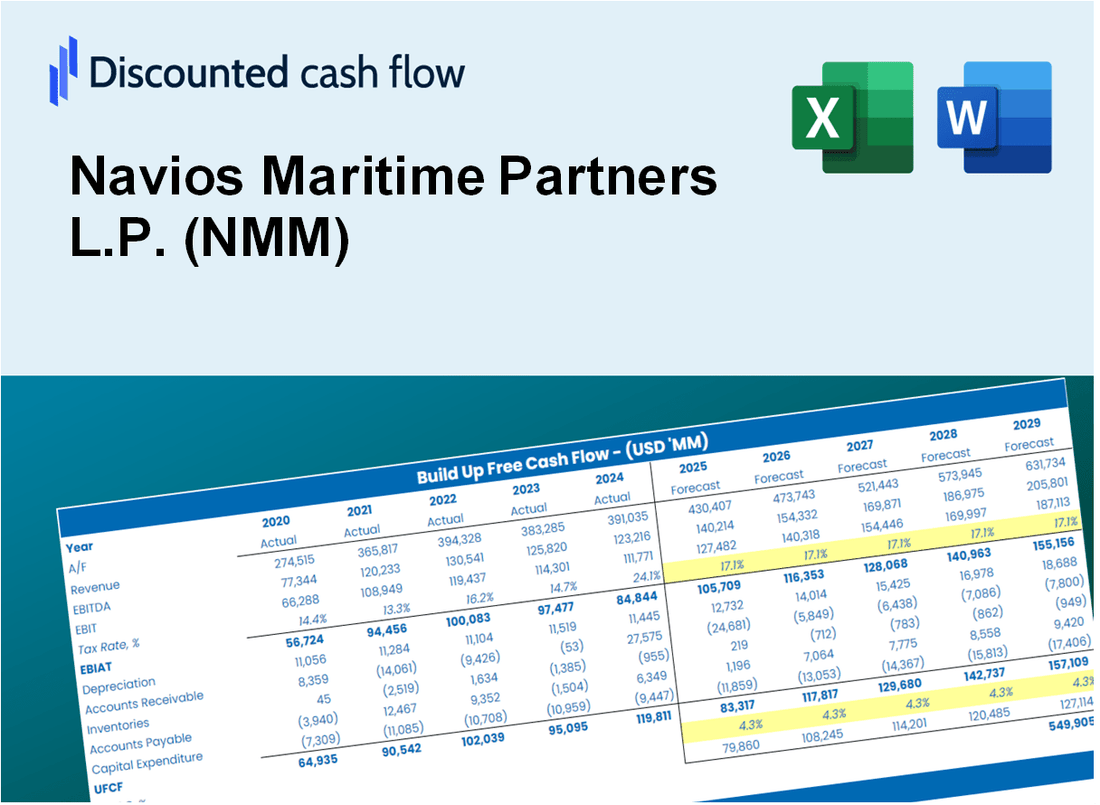
Navios Maritime Partners L.P. (NMM) Bundle
Simplify Navios Maritime Partners L.P. (NMM) Valation avec cette calculatrice DCF personnalisable! Doté de Real Navios Maritime Partners L.P. (NMM) Financials and Adjustable Forecast Intarts, vous pouvez tester les scénarios et découvrir la juste valeur NAVIOS Maritime Partners L.P. (NMM) en minutes.
Discounted Cash Flow (DCF) - (USD MM)
| Year | AY1 2020 |
AY2 2021 |
AY3 2022 |
AY4 2023 |
AY5 2024 |
FY1 2025 |
FY2 2026 |
FY3 2027 |
FY4 2028 |
FY5 2029 |
|---|---|---|---|---|---|---|---|---|---|---|
| Revenue | 226.8 | 713.2 | 1,210.5 | 1,306.9 | 1,334.1 | 1,373.6 | 1,414.3 | 1,456.2 | 1,499.4 | 1,543.8 |
| Revenue Growth, % | 0 | 214.49 | 69.74 | 7.96 | 2.08 | 2.96 | 2.96 | 2.96 | 2.96 | 2.96 |
| EBITDA | 21.8 | 601.8 | 897.0 | 794.0 | 655.3 | 763.7 | 786.3 | 809.6 | 833.6 | 858.3 |
| EBITDA, % | 9.63 | 84.38 | 74.1 | 60.76 | 49.12 | 55.6 | 55.6 | 55.6 | 55.6 | 55.6 |
| Depreciation | 67.3 | 128.6 | 234.6 | 226.7 | 215.8 | 276.4 | 284.6 | 293.1 | 301.8 | 310.7 |
| Depreciation, % | 29.7 | 18.03 | 19.38 | 17.35 | 16.17 | 20.13 | 20.13 | 20.13 | 20.13 | 20.13 |
| EBIT | -45.5 | 473.2 | 662.3 | 567.3 | 439.6 | 487.2 | 501.7 | 516.5 | 531.8 | 547.6 |
| EBIT, % | -20.07 | 66.35 | 54.71 | 43.41 | 32.95 | 35.47 | 35.47 | 35.47 | 35.47 | 35.47 |
| Total Cash | 19.3 | 159.5 | 157.8 | 287.4 | 282.5 | 239.2 | 246.3 | 253.6 | 261.1 | 268.8 |
| Total Cash, percent | .0 | .0 | .0 | .0 | .0 | .0 | .0 | .0 | .0 | .0 |
| Account Receivables | 22.6 | 29.3 | 87.7 | 50.7 | 75.7 | 84.9 | 87.4 | 90.0 | 92.6 | 95.4 |
| Account Receivables, % | 9.97 | 4.11 | 7.25 | 3.88 | 5.68 | 6.18 | 6.18 | 6.18 | 6.18 | 6.18 |
| Inventories | 6.3 | 21.1 | 32.7 | 37.6 | 32.8 | 37.8 | 38.9 | 40.0 | 41.2 | 42.5 |
| Inventories, % | 2.76 | 2.95 | 2.7 | 2.87 | 2.46 | 2.75 | 2.75 | 2.75 | 2.75 | 2.75 |
| Accounts Payable | 5.5 | 17.4 | 25.4 | 24.0 | 17.0 | 27.6 | 28.5 | 29.3 | 30.2 | 31.1 |
| Accounts Payable, % | 2.41 | 2.45 | 2.09 | 1.84 | 1.27 | 2.01 | 2.01 | 2.01 | 2.01 | 2.01 |
| Capital Expenditure | -83.1 | -278.9 | -610.6 | -465.0 | -1,007.1 | -651.8 | -671.1 | -691.0 | -711.5 | -732.6 |
| Capital Expenditure, % | -36.65 | -39.1 | -50.44 | -35.58 | -75.49 | -47.45 | -47.45 | -47.45 | -47.45 | -47.45 |
| Tax Rate, % | 0 | 0 | 0 | 0 | 0 | 0 | 0 | 0 | 0 | 0 |
| EBITAT | -45.5 | 477.7 | 662.3 | 567.3 | 439.6 | 487.2 | 501.7 | 516.5 | 531.8 | 547.6 |
| Depreciation | ||||||||||
| Changes in Account Receivables | ||||||||||
| Changes in Inventories | ||||||||||
| Changes in Accounts Payable | ||||||||||
| Capital Expenditure | ||||||||||
| UFCF | -84.7 | 317.8 | 224.3 | 359.7 | -379.1 | 108.4 | 112.4 | 115.7 | 119.1 | 122.6 |
| WACC, % | 9.68 | 9.68 | 9.68 | 9.68 | 9.68 | 9.68 | 9.68 | 9.68 | 9.68 | 9.68 |
| PV UFCF | ||||||||||
| SUM PV UFCF | 439.6 | |||||||||
| Long Term Growth Rate, % | 0.50 | |||||||||
| Free cash flow (T + 1) | 123 | |||||||||
| Terminal Value | 1,343 | |||||||||
| Present Terminal Value | 846 | |||||||||
| Enterprise Value | 1,286 | |||||||||
| Net Debt | 1,154 | |||||||||
| Equity Value | 132 | |||||||||
| Diluted Shares Outstanding, MM | 30 | |||||||||
| Equity Value Per Share | 4.40 |
What You Will Receive
- Authentic Navios Data: Preloaded financial metrics – from revenue to EBITDA – derived from actual and projected figures.
- Comprehensive Customization: Modify all essential parameters (yellow cells) such as WACC, growth %, and tax rates.
- Immediate Valuation Adjustments: Automatic recalculations to assess the effect of changes on Navios Maritime Partners L.P. (NMM)’s fair value.
- Flexible Excel Template: Designed for quick modifications, scenario analysis, and in-depth projections.
- Efficient and Precise: Avoid constructing models from the ground up while ensuring accuracy and adaptability.
Key Features
- Comprehensive Data: Navios Maritime Partners L.P. (NMM) historical financial statements and pre-populated projections.
- Customizable Parameters: Modify WACC, tax rates, revenue growth, and EBITDA margins as needed.
- Real-Time Insights: View the intrinsic value of Navios Maritime Partners L.P. (NMM) update instantly.
- Intuitive Visualizations: Dashboard graphs showcase valuation outcomes and essential metrics.
- Designed for Precision: A reliable tool for analysts, investors, and finance professionals.
How It Works
- Download the Template: Gain immediate access to the Excel-based NMM DCF Calculator.
- Input Your Assumptions: Modify the yellow-highlighted cells for growth rates, WACC, margins, and additional parameters.
- Instant Calculations: The model automatically recalculates Navios Maritime Partners' intrinsic value.
- Test Scenarios: Experiment with various assumptions to assess potential valuation shifts.
- Analyze and Decide: Utilize the outcomes to inform your investment or financial decisions.
Why Choose the Navios Maritime Partners L.P. (NMM) Calculator?
- Accuracy: Reliable maritime financials guarantee precise data.
- Flexibility: Tailored for users to easily adjust and experiment with inputs.
- Time-Saving: Avoid the complexities of constructing a DCF model from the ground up.
- Professional-Grade: Crafted with the precision and usability expected at the CFO level.
- User-Friendly: Intuitive design makes it accessible for users without advanced financial modeling skills.
Who Should Use Navios Maritime Partners L.P. (NMM)?
- Investors: Make informed investment choices with insights from a leading maritime partnership.
- Financial Analysts: Streamline your analysis with comprehensive data on shipping and logistics.
- Consultants: Efficiently tailor reports and presentations using industry-specific metrics.
- Shipping Enthusiasts: Enhance your knowledge of maritime operations through detailed case studies.
- Educators and Students: Utilize it as a valuable resource for courses in maritime economics and finance.
What the Template Contains
- Comprehensive DCF Model: Editable template with detailed valuation calculations tailored for Navios Maritime Partners L.P. (NMM).
- Real-World Data: Navios Maritime Partners L.P. (NMM)’s historical and projected financials preloaded for analysis.
- Customizable Parameters: Adjust WACC, growth rates, and tax assumptions to test various scenarios.
- Financial Statements: Full annual and quarterly breakdowns for deeper insights into Navios Maritime Partners L.P. (NMM).
- Key Ratios: Built-in analysis for profitability, efficiency, and leverage specific to Navios Maritime Partners L.P. (NMM).
- Dashboard with Visual Outputs: Charts and tables for clear, actionable results regarding Navios Maritime Partners L.P. (NMM).
Disclaimer
All information, articles, and product details provided on this website are for general informational and educational purposes only. We do not claim any ownership over, nor do we intend to infringe upon, any trademarks, copyrights, logos, brand names, or other intellectual property mentioned or depicted on this site. Such intellectual property remains the property of its respective owners, and any references here are made solely for identification or informational purposes, without implying any affiliation, endorsement, or partnership.
We make no representations or warranties, express or implied, regarding the accuracy, completeness, or suitability of any content or products presented. Nothing on this website should be construed as legal, tax, investment, financial, medical, or other professional advice. In addition, no part of this site—including articles or product references—constitutes a solicitation, recommendation, endorsement, advertisement, or offer to buy or sell any securities, franchises, or other financial instruments, particularly in jurisdictions where such activity would be unlawful.
All content is of a general nature and may not address the specific circumstances of any individual or entity. It is not a substitute for professional advice or services. Any actions you take based on the information provided here are strictly at your own risk. You accept full responsibility for any decisions or outcomes arising from your use of this website and agree to release us from any liability in connection with your use of, or reliance upon, the content or products found herein.