
|
Nokia Oyj (NOK) DCF Valation |
Entièrement Modifiable: Adapté À Vos Besoins Dans Excel Ou Sheets
Conception Professionnelle: Modèles Fiables Et Conformes Aux Normes Du Secteur
Pré-Construits Pour Une Utilisation Rapide Et Efficace
Compatible MAC/PC, entièrement débloqué
Aucune Expertise N'Est Requise; Facile À Suivre
Nokia Oyj (NOK) Bundle
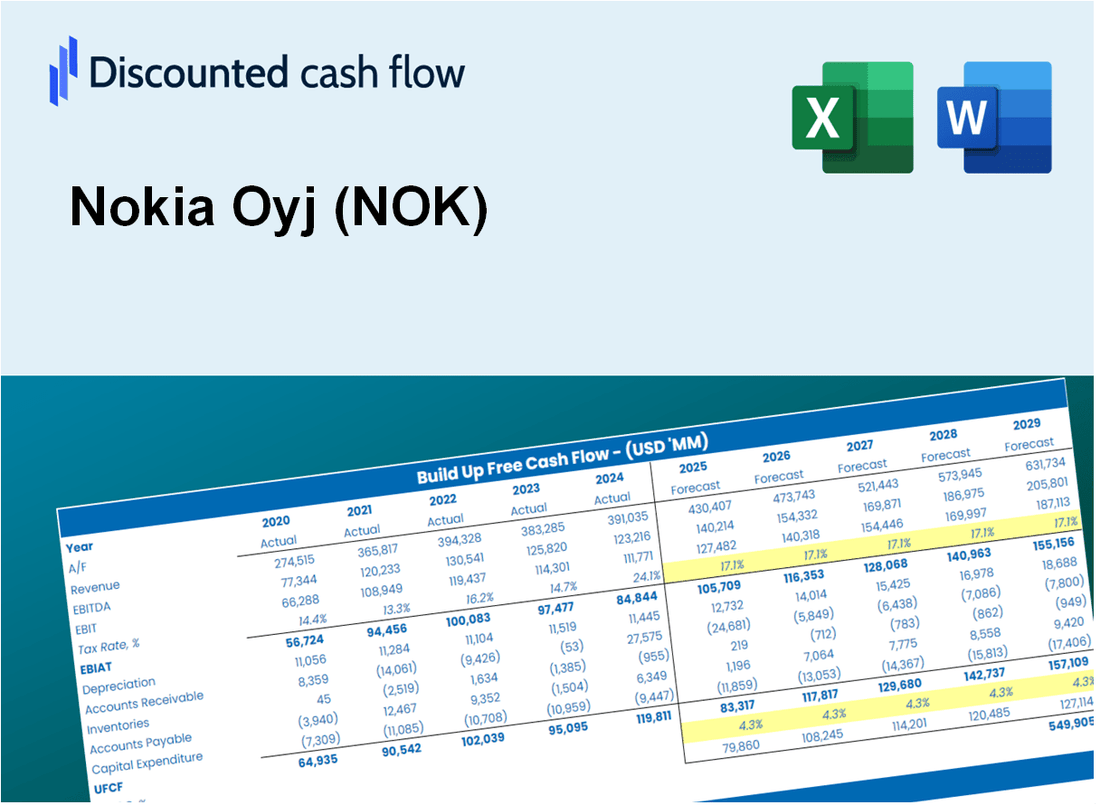
Explorez l'avenir financier de Nokia OYJ (NOK) avec notre calculatrice DCF conviviale! Entrez vos projections pour la croissance, les marges et les dépenses pour calculer la valeur intrinsèque de Nokia OYJ (NOK) et affiner votre approche d'investissement.
Discounted Cash Flow (DCF) - (USD MM)
| Year | AY1 2020 |
AY2 2021 |
AY3 2022 |
AY4 2023 |
AY5 2024 |
FY1 2025 |
FY2 2026 |
FY3 2027 |
FY4 2028 |
FY5 2029 |
|---|---|---|---|---|---|---|---|---|---|---|
| Revenue | 25,798.7 | 26,194.0 | 29,390.0 | 26,260.0 | 22,675.8 | 22,076.8 | 21,493.7 | 20,926.0 | 20,373.3 | 19,835.1 |
| Revenue Growth, % | 0 | 1.53 | 12.2 | -10.65 | -13.65 | -2.64 | -2.64 | -2.64 | -2.64 | -2.64 |
| EBITDA | 2,418.6 | 3,807.2 | 4,183.6 | 3,473.3 | 4,049.1 | 3,056.6 | 2,975.9 | 2,897.3 | 2,820.8 | 2,746.3 |
| EBITDA, % | 9.37 | 14.53 | 14.23 | 13.23 | 17.86 | 13.85 | 13.85 | 13.85 | 13.85 | 13.85 |
| Depreciation | 1,343.8 | 1,333.2 | 1,345.0 | 1,282.4 | 1,196.3 | 1,105.3 | 1,076.2 | 1,047.7 | 1,020.1 | 993.1 |
| Depreciation, % | 5.21 | 5.09 | 4.58 | 4.88 | 5.28 | 5.01 | 5.01 | 5.01 | 5.01 | 5.01 |
| EBIT | 1,074.8 | 2,474.0 | 2,838.6 | 2,190.9 | 2,852.8 | 1,951.3 | 1,899.8 | 1,849.6 | 1,800.7 | 1,753.2 |
| EBIT, % | 4.17 | 9.45 | 9.66 | 8.34 | 12.58 | 8.84 | 8.84 | 8.84 | 8.84 | 8.84 |
| Total Cash | 9,762.9 | 11,330.8 | 10,809.3 | 9,721.6 | 10,515.6 | 8,886.9 | 8,652.2 | 8,423.7 | 8,201.2 | 7,984.5 |
| Total Cash, percent | .0 | .0 | .0 | .0 | .0 | .0 | .0 | .0 | .0 | .0 |
| Account Receivables | 7,766.6 | 7,701.7 | 1,383.9 | 7,951.9 | 7,949.5 | 5,720.3 | 5,569.2 | 5,422.1 | 5,278.9 | 5,139.5 |
| Account Receivables, % | 30.1 | 29.4 | 4.71 | 30.28 | 35.06 | 25.91 | 25.91 | 25.91 | 25.91 | 25.91 |
| Inventories | 2,652.2 | 2,822.1 | 3,852.1 | 3,207.9 | 2,551.9 | 2,544.6 | 2,477.4 | 2,412.0 | 2,348.2 | 2,286.2 |
| Inventories, % | 10.28 | 10.77 | 13.11 | 12.22 | 11.25 | 11.53 | 11.53 | 11.53 | 11.53 | 11.53 |
| Accounts Payable | 3,744.7 | 4,340.5 | 5,580.5 | 4,038.5 | 3,790.7 | 3,628.1 | 3,532.2 | 3,438.9 | 3,348.1 | 3,259.7 |
| Accounts Payable, % | 14.52 | 16.57 | 18.99 | 15.38 | 16.72 | 16.43 | 16.43 | 16.43 | 16.43 | 16.43 |
| Capital Expenditure | -565.1 | -660.7 | -709.1 | -769.2 | -556.9 | -552.4 | -537.8 | -523.6 | -509.8 | -496.3 |
| Capital Expenditure, % | -2.19 | -2.52 | -2.41 | -2.93 | -2.46 | -2.5 | -2.5 | -2.5 | -2.5 | -2.5 |
| Tax Rate, % | 38.93 | 38.93 | 38.93 | 38.93 | 38.93 | 38.93 | 38.93 | 38.93 | 38.93 | 38.93 |
| EBITAT | -3,120.0 | 2,084.8 | 5,523.8 | 971.9 | 1,742.2 | 1,130.6 | 1,100.7 | 1,071.7 | 1,043.3 | 1,015.8 |
| Depreciation | ||||||||||
| Changes in Account Receivables | ||||||||||
| Changes in Inventories | ||||||||||
| Changes in Accounts Payable | ||||||||||
| Capital Expenditure | ||||||||||
| UFCF | -9,015.5 | 3,248.1 | 12,687.6 | -5,980.6 | 2,792.2 | 3,757.4 | 1,761.6 | 1,715.0 | 1,669.7 | 1,625.6 |
| WACC, % | 5.41 | 6.28 | 6.44 | 5.87 | 6.04 | 6.01 | 6.01 | 6.01 | 6.01 | 6.01 |
| PV UFCF | ||||||||||
| SUM PV UFCF | 9,088.0 | |||||||||
| Long Term Growth Rate, % | 2.00 | |||||||||
| Free cash flow (T + 1) | 1,658 | |||||||||
| Terminal Value | 41,362 | |||||||||
| Present Terminal Value | 30,895 | |||||||||
| Enterprise Value | 39,983 | |||||||||
| Net Debt | -2,210 | |||||||||
| Equity Value | 42,193 | |||||||||
| Diluted Shares Outstanding, MM | 5,532 | |||||||||
| Equity Value Per Share | 7.63 |
What You Will Receive
- Pre-Filled Financial Model: Nokia’s actual data provides an accurate basis for DCF valuation.
- Comprehensive Forecast Control: Modify revenue growth, profit margins, WACC, and other essential factors.
- Real-Time Calculations: Instant updates allow you to view results as you adjust inputs.
- Professional-Grade Template: A polished Excel file crafted for high-quality valuation presentations.
- Flexible and Reusable: Designed for adaptability, enabling repeated use for in-depth forecasts.
Key Features
- Comprehensive DCF Calculator: Offers detailed unlevered and levered DCF valuation models tailored for Nokia Oyj (NOK).
- WACC Calculator: Features a pre-built Weighted Average Cost of Capital sheet with adjustable inputs for personalized analysis.
- Customizable Forecast Assumptions: Easily modify growth rates, capital expenditures, and discount rates to fit your analysis.
- Integrated Financial Ratios: Evaluate profitability, leverage, and efficiency ratios specifically for Nokia Oyj (NOK).
- Interactive Dashboard and Charts: Visual representations summarize essential valuation metrics for straightforward analysis.
How It Works
- Step 1: Download the prebuilt Excel template containing Nokia Oyj's (NOK) data.
- Step 2: Navigate through the pre-filled sheets to familiarize yourself with the essential metrics.
- Step 3: Update forecasts and assumptions in the editable yellow cells (WACC, growth, margins).
- Step 4: Instantly see recalculated results, including Nokia Oyj's (NOK) intrinsic value.
- Step 5: Make informed investment decisions or generate reports based on the outputs.
Why Choose This Calculator?
- Accurate Data: Real Nokia Oyj (NOK) financials ensure reliable valuation results.
- Customizable: Adjust key parameters like growth rates, WACC, and tax rates to align with your forecasts.
- Time-Saving: Pre-built calculations save you from starting from scratch.
- Professional-Grade Tool: Tailored for investors, analysts, and consultants.
- User-Friendly: Intuitive design and step-by-step instructions make it accessible for all users.
Who Should Use Nokia Oyj (NOK) Products?
- Telecom Investors: Gain insights into the telecommunications market with advanced analytics tools.
- Market Analysts: Streamline your research with comprehensive data on Nokia Oyj (NOK) operations.
- Consultants: Effortlessly modify reports and presentations tailored to client needs.
- Technology Enthusiasts: Explore the latest innovations and their impact on the industry.
- Educators and Students: Utilize resources for hands-on learning in technology and business courses.
What the Template Contains
- Pre-Filled Data: Includes Nokia Oyj’s historical financials and forecasts.
- Discounted Cash Flow Model: Editable DCF valuation model with automatic calculations.
- Weighted Average Cost of Capital (WACC): A dedicated sheet for calculating WACC based on custom inputs.
- Key Financial Ratios: Analyze Nokia Oyj’s profitability, efficiency, and leverage.
- Customizable Inputs: Edit revenue growth, margins, and tax rates with ease.
- Clear Dashboard: Charts and tables summarizing key valuation results.
Disclaimer
All information, articles, and product details provided on this website are for general informational and educational purposes only. We do not claim any ownership over, nor do we intend to infringe upon, any trademarks, copyrights, logos, brand names, or other intellectual property mentioned or depicted on this site. Such intellectual property remains the property of its respective owners, and any references here are made solely for identification or informational purposes, without implying any affiliation, endorsement, or partnership.
We make no representations or warranties, express or implied, regarding the accuracy, completeness, or suitability of any content or products presented. Nothing on this website should be construed as legal, tax, investment, financial, medical, or other professional advice. In addition, no part of this site—including articles or product references—constitutes a solicitation, recommendation, endorsement, advertisement, or offer to buy or sell any securities, franchises, or other financial instruments, particularly in jurisdictions where such activity would be unlawful.
All content is of a general nature and may not address the specific circumstances of any individual or entity. It is not a substitute for professional advice or services. Any actions you take based on the information provided here are strictly at your own risk. You accept full responsibility for any decisions or outcomes arising from your use of this website and agree to release us from any liability in connection with your use of, or reliance upon, the content or products found herein.