
|
Nerdy, Inc. (NRDY) Évaluation DCF |
Entièrement Modifiable: Adapté À Vos Besoins Dans Excel Ou Sheets
Conception Professionnelle: Modèles Fiables Et Conformes Aux Normes Du Secteur
Pré-Construits Pour Une Utilisation Rapide Et Efficace
Compatible MAC/PC, entièrement débloqué
Aucune Expertise N'Est Requise; Facile À Suivre
Nerdy, Inc. (NRDY) Bundle
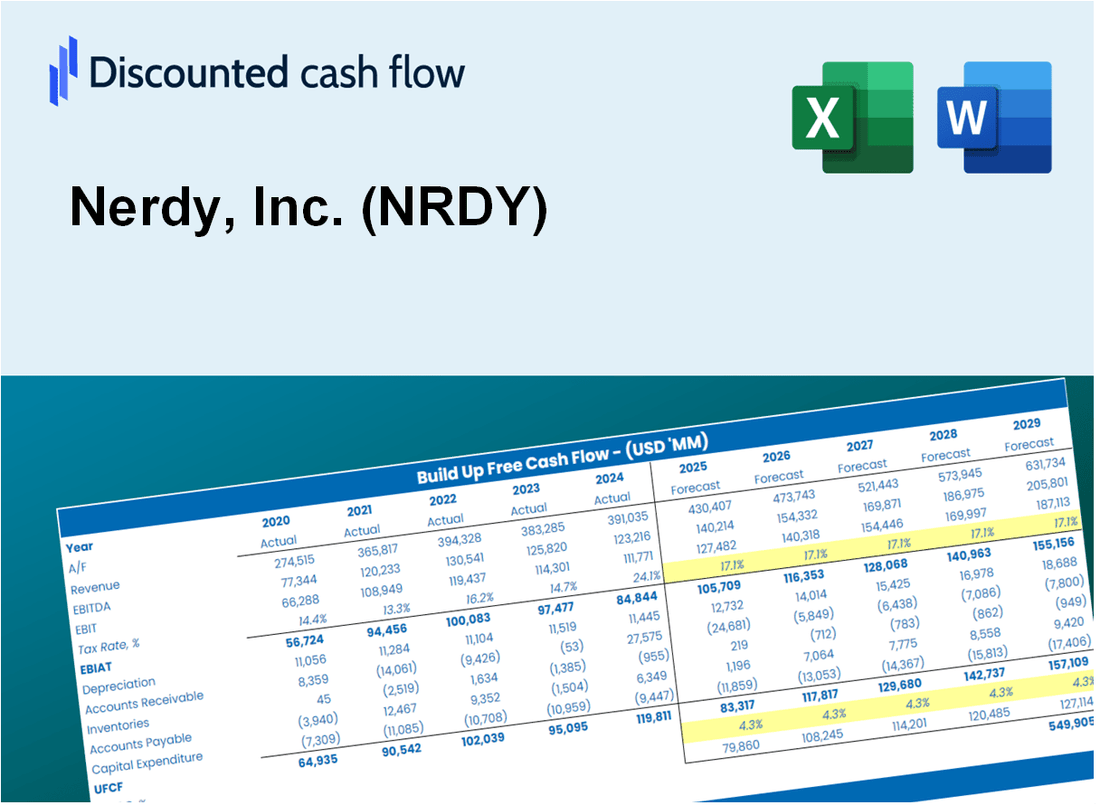
Évaluez les perspectives financières de Nerdy, Inc. comme un pro! Ce (NRDY) Calculator DCF fournit des données financières pré-remplies ainsi que la flexibilité pour modifier la croissance des revenus, le WACC, les marges et d'autres hypothèses essentielles pour s'aligner sur vos prévisions.
What You Will Get
- Genuine Nerdy Data: Preloaded financials – encompassing revenue to EBIT – derived from actual and projected figures.
- Comprehensive Customization: Modify all essential parameters (yellow cells) such as WACC, growth %, and tax rates.
- Immediate Valuation Updates: Automatic recalculations to assess the impact of changes on Nerdy, Inc.'s (NRDY) fair value.
- Flexible Excel Template: Designed for quick edits, scenario analysis, and in-depth projections.
- Efficient and Accurate: Avoid the hassle of building models from the ground up while ensuring precision and adaptability.
Key Features
- Customizable Learning Metrics: Adjust essential parameters such as user engagement, course completion rates, and revenue forecasts.
- Instant Course Valuation: Provides immediate assessments of course profitability and market potential.
- High-Precision Analytics: Leverages Nerdy’s (NRDY) actual performance data for accurate educational insights.
- Effortless Scenario Testing: Easily explore various educational strategies and analyze their impacts.
- Efficiency Booster: Streamline the process of evaluating educational programs without the need for complex models.
How It Functions
- Download the Template: Gain immediate access to the Excel-based NRDY DCF Calculator.
- Input Your Assumptions: Modify the yellow-highlighted cells for growth rates, WACC, margins, and more.
- Instant Calculations: The model automatically recalculates Nerdy’s intrinsic value.
- Test Scenarios: Experiment with different assumptions to assess potential valuation variations.
- Analyze and Decide: Utilize the results to inform your investment or financial analysis.
Why Choose This Calculator for Nerdy, Inc. (NRDY)?
- User-Friendly Interface: Perfectly crafted for both novices and seasoned users.
- Customizable Inputs: Adjust parameters effortlessly to suit your financial assessments.
- Real-Time Feedback: Observe immediate changes in Nerdy’s valuation as you tweak the inputs.
- Pre-Configured Data: Comes with Nerdy’s actual financial details for swift evaluations.
- Relied Upon by Experts: Favored by investors and analysts for making well-informed choices.
Who Should Use This Product?
- Investors: Accurately assess Nerdy, Inc.’s (NRDY) intrinsic value prior to making investment choices.
- CFOs: Utilize a high-quality DCF model for financial reporting and performance evaluation.
- Consultants: Efficiently modify the template for client valuation reports.
- Entrepreneurs: Acquire knowledge of financial modeling practices employed by leading companies.
- Educators: Implement it as a resource to illustrate valuation techniques in the classroom.
What the Template Contains
- Preloaded NRDY Data: Historical and projected financial data, including revenue, EBIT, and capital expenditures.
- DCF and WACC Models: Professional-grade sheets for calculating intrinsic value and Weighted Average Cost of Capital.
- Editable Inputs: Yellow-highlighted cells for adjusting revenue growth, tax rates, and discount rates.
- Financial Statements: Comprehensive annual and quarterly financials for deeper analysis.
- Key Ratios: Profitability, leverage, and efficiency ratios to evaluate performance.
- Dashboard and Charts: Visual summaries of valuation outcomes and assumptions.
Disclaimer
All information, articles, and product details provided on this website are for general informational and educational purposes only. We do not claim any ownership over, nor do we intend to infringe upon, any trademarks, copyrights, logos, brand names, or other intellectual property mentioned or depicted on this site. Such intellectual property remains the property of its respective owners, and any references here are made solely for identification or informational purposes, without implying any affiliation, endorsement, or partnership.
We make no representations or warranties, express or implied, regarding the accuracy, completeness, or suitability of any content or products presented. Nothing on this website should be construed as legal, tax, investment, financial, medical, or other professional advice. In addition, no part of this site—including articles or product references—constitutes a solicitation, recommendation, endorsement, advertisement, or offer to buy or sell any securities, franchises, or other financial instruments, particularly in jurisdictions where such activity would be unlawful.
All content is of a general nature and may not address the specific circumstances of any individual or entity. It is not a substitute for professional advice or services. Any actions you take based on the information provided here are strictly at your own risk. You accept full responsibility for any decisions or outcomes arising from your use of this website and agree to release us from any liability in connection with your use of, or reliance upon, the content or products found herein.