
|
Insight Enterprises, Inc. (NSIT) Évaluation DCF |
Entièrement Modifiable: Adapté À Vos Besoins Dans Excel Ou Sheets
Conception Professionnelle: Modèles Fiables Et Conformes Aux Normes Du Secteur
Pré-Construits Pour Une Utilisation Rapide Et Efficace
Compatible MAC/PC, entièrement débloqué
Aucune Expertise N'Est Requise; Facile À Suivre
Insight Enterprises, Inc. (NSIT) Bundle
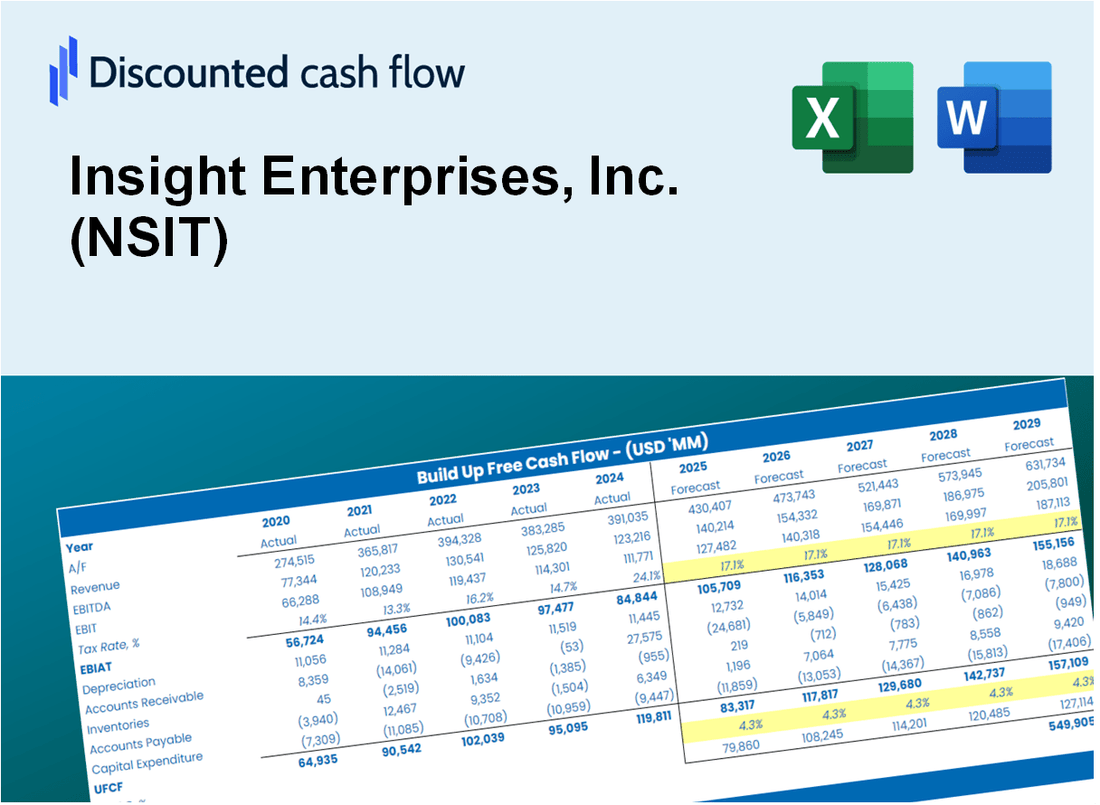
Gagnez la maîtrise sur votre analyse d'évaluation Insight Enterprises, Inc. (NSIT) à l'aide de notre calculatrice DCF à la pointe de la technologie! Ce modèle Excel est préchargé avec des données authentiques (NSIT), vous permettant d'ajuster les prévisions et les hypothèses pour déterminer avec précision la valeur intrinsèque d'Insight Enterprises, Inc.
What You Will Get
- Comprehensive NSIT Financials: Access historical and projected data for precise valuation.
- Customizable Inputs: Adjust WACC, tax rates, revenue growth, and capital expenditures as needed.
- Real-Time Calculations: Intrinsic value and NPV are computed automatically.
- Scenario Analysis: Explore various scenarios to assess Insight Enterprises' future performance.
- User-Friendly Interface: Designed for professionals while remaining approachable for newcomers.
Key Features
- Comprehensive NSIT Data: Pre-loaded with Insight Enterprises' historical performance metrics and future forecasts.
- Tailorable Input Options: Modify revenue growth rates, profit margins, WACC, tax implications, and capital investments.
- Interactive Valuation Framework: Automatically refreshes Net Present Value (NPV) and intrinsic value based on user-defined parameters.
- Scenario Analysis: Develop various forecasting scenarios to evaluate differing valuation results.
- Intuitive User Interface: Designed to be straightforward and accessible for both industry experts and newcomers.
How It Works
- Step 1: Download the Excel file.
- Step 2: Review pre-entered Insight Enterprises data (historical and projected).
- Step 3: Adjust key assumptions (yellow cells) based on your analysis.
- Step 4: View automatic recalculations for Insight Enterprises' intrinsic value.
- Step 5: Use the outputs for investment decisions or reporting.
Why Choose This Calculator for Insight Enterprises, Inc. (NSIT)?
- Designed for Experts: A sophisticated tool tailored for analysts, financial officers, and consultants.
- Accurate Financials: Insight Enterprises' historical and projected financial data preloaded for precision.
- Flexible Scenario Analysis: Effortlessly simulate various forecasts and assumptions.
- Comprehensive Outputs: Automatically computes intrinsic value, NPV, and essential metrics.
- User-Friendly: Step-by-step guidance ensures a smooth experience throughout the process.
Who Should Use This Product?
- Individual Investors: Gain valuable insights for making informed decisions regarding Insight Enterprises, Inc. (NSIT) stock.
- Financial Analysts: Enhance valuation processes with comprehensive financial models tailored for Insight Enterprises, Inc. (NSIT).
- Consultants: Provide clients with accurate and timely valuation insights related to Insight Enterprises, Inc. (NSIT).
- Business Owners: Learn how companies like Insight Enterprises, Inc. (NSIT) are valued to inform your own business strategies.
- Finance Students: Explore valuation methodologies using real data and case studies from Insight Enterprises, Inc. (NSIT).
What the Template Contains
- Pre-Filled DCF Model: Insight Enterprises, Inc.'s (NSIT) financial data preloaded for immediate use.
- WACC Calculator: Detailed calculations for Weighted Average Cost of Capital.
- Financial Ratios: Evaluate Insight Enterprises, Inc.'s (NSIT) profitability, leverage, and efficiency.
- Editable Inputs: Change assumptions such as growth, margins, and CAPEX to fit your scenarios.
- Financial Statements: Annual and quarterly reports to support detailed analysis.
- Interactive Dashboard: Easily visualize key valuation metrics and results.
Disclaimer
All information, articles, and product details provided on this website are for general informational and educational purposes only. We do not claim any ownership over, nor do we intend to infringe upon, any trademarks, copyrights, logos, brand names, or other intellectual property mentioned or depicted on this site. Such intellectual property remains the property of its respective owners, and any references here are made solely for identification or informational purposes, without implying any affiliation, endorsement, or partnership.
We make no representations or warranties, express or implied, regarding the accuracy, completeness, or suitability of any content or products presented. Nothing on this website should be construed as legal, tax, investment, financial, medical, or other professional advice. In addition, no part of this site—including articles or product references—constitutes a solicitation, recommendation, endorsement, advertisement, or offer to buy or sell any securities, franchises, or other financial instruments, particularly in jurisdictions where such activity would be unlawful.
All content is of a general nature and may not address the specific circumstances of any individual or entity. It is not a substitute for professional advice or services. Any actions you take based on the information provided here are strictly at your own risk. You accept full responsibility for any decisions or outcomes arising from your use of this website and agree to release us from any liability in connection with your use of, or reliance upon, the content or products found herein.