
|
Northern Technologies International Corporation (NTIC) Évaluation DCF |
Entièrement Modifiable: Adapté À Vos Besoins Dans Excel Ou Sheets
Conception Professionnelle: Modèles Fiables Et Conformes Aux Normes Du Secteur
Pré-Construits Pour Une Utilisation Rapide Et Efficace
Compatible MAC/PC, entièrement débloqué
Aucune Expertise N'Est Requise; Facile À Suivre
Northern Technologies International Corporation (NTIC) Bundle
Améliorez votre stratégie d'investissement avec la calculatrice (NTIC) DCF! Explorez les données financières de la Corporation internationale authentique Northern Technologies, ajustez les estimations et les dépenses de la croissance et observez instantanément comment ces modifications affectent la valeur intrinsèque de (NTIC).
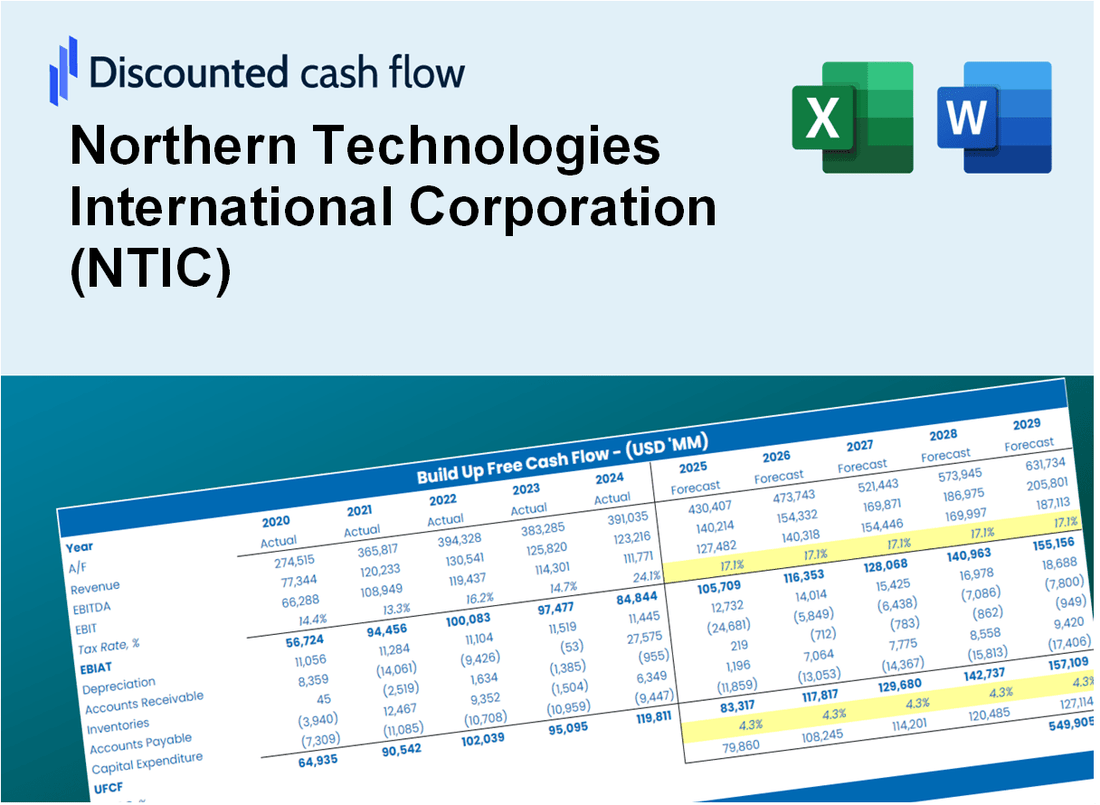
Discounted Cash Flow (DCF) - (USD MM)
| Year | AY1 2020 |
AY2 2021 |
AY3 2022 |
AY4 2023 |
AY5 2024 |
FY1 2025 |
FY2 2026 |
FY3 2027 |
FY4 2028 |
FY5 2029 |
|---|---|---|---|---|---|---|---|---|---|---|
| Revenue | 47.6 | 56.5 | 74.2 | 79.9 | 85.1 | 98.7 | 114.5 | 132.8 | 154.1 | 178.8 |
| Revenue Growth, % | 0 | 18.59 | 31.27 | 7.75 | 6.45 | 16.01 | 16.01 | 16.01 | 16.01 | 16.01 |
| EBITDA | -1.6 | 2.0 | 2.0 | 1.2 | 9.7 | 3.1 | 3.6 | 4.2 | 4.8 | 5.6 |
| EBITDA, % | -3.39 | 3.48 | 2.68 | 1.5 | 11.45 | 3.15 | 3.15 | 3.15 | 3.15 | 3.15 |
| Depreciation | 1.1 | 1.1 | 1.6 | 1.6 | 1.8 | 2.1 | 2.4 | 2.8 | 3.2 | 3.7 |
| Depreciation, % | 2.24 | 1.96 | 2.11 | 2.04 | 2.06 | 2.08 | 2.08 | 2.08 | 2.08 | 2.08 |
| EBIT | -2.7 | .9 | .4 | -.4 | 8.0 | 1.0 | 1.2 | 1.4 | 1.6 | 1.9 |
| EBIT, % | -5.63 | 1.52 | 0.56926 | -0.54075 | 9.39 | 1.06 | 1.06 | 1.06 | 1.06 | 1.06 |
| Total Cash | 11.9 | 7.7 | 5.3 | 5.4 | 5.0 | 11.5 | 13.4 | 15.5 | 18.0 | 20.9 |
| Total Cash, percent | .0 | .0 | .0 | .0 | .0 | .0 | .0 | .0 | .0 | .0 |
| Account Receivables | 9.5 | 13.6 | 16.6 | 19.1 | 20.8 | 22.7 | 26.3 | 30.5 | 35.4 | 41.1 |
| Account Receivables, % | 19.93 | 24.15 | 22.38 | 23.97 | 24.47 | 22.98 | 22.98 | 22.98 | 22.98 | 22.98 |
| Inventories | 11.0 | 11.1 | 16.3 | 13.1 | 14.4 | 19.3 | 22.4 | 26.0 | 30.2 | 35.0 |
| Inventories, % | 23.01 | 19.67 | 22.04 | 16.39 | 16.92 | 19.61 | 19.61 | 19.61 | 19.61 | 19.61 |
| Accounts Payable | 3.2 | 4.3 | 7.8 | 6.1 | 6.4 | 7.9 | 9.1 | 10.6 | 12.3 | 14.3 |
| Accounts Payable, % | 6.73 | 7.6 | 10.51 | 7.58 | 7.52 | 7.99 | 7.99 | 7.99 | 7.99 | 7.99 |
| Capital Expenditure | -.8 | -5.6 | -1.7 | -3.4 | -3.4 | -4.4 | -5.1 | -5.9 | -6.8 | -7.9 |
| Capital Expenditure, % | -1.69 | -9.99 | -2.3 | -4.21 | -4.02 | -4.44 | -4.44 | -4.44 | -4.44 | -4.44 |
| Tax Rate, % | 29.27 | 29.27 | 29.27 | 29.27 | 29.27 | 29.27 | 29.27 | 29.27 | 29.27 | 29.27 |
| EBITAT | 1.4 | .6 | .3 | -.2 | 5.6 | .6 | .6 | .8 | .9 | 1.0 |
| Depreciation | ||||||||||
| Changes in Account Receivables | ||||||||||
| Changes in Inventories | ||||||||||
| Changes in Accounts Payable | ||||||||||
| Capital Expenditure | ||||||||||
| UFCF | -15.6 | -7.1 | -4.5 | -3.0 | 1.4 | -7.1 | -7.5 | -8.7 | -10.1 | -11.7 |
| WACC, % | 4.28 | 4.57 | 4.55 | 4.48 | 4.55 | 4.49 | 4.49 | 4.49 | 4.49 | 4.49 |
| PV UFCF | ||||||||||
| SUM PV UFCF | -39.2 | |||||||||
| Long Term Growth Rate, % | 3.50 | |||||||||
| Free cash flow (T + 1) | -12 | |||||||||
| Terminal Value | -1,232 | |||||||||
| Present Terminal Value | -989 | |||||||||
| Enterprise Value | -1,028 | |||||||||
| Net Debt | 3 | |||||||||
| Equity Value | -1,031 | |||||||||
| Diluted Shares Outstanding, MM | 10 | |||||||||
| Equity Value Per Share | -104.83 |
What You Will Get
- Authentic NTIC Data: Preloaded financial metrics – from revenue to EBIT – based on real and projected figures.
- Comprehensive Customization: Modify all essential parameters (yellow cells) such as WACC, growth %, and tax rates.
- Immediate Valuation Updates: Automatic recalculations to assess the impact of changes on NTIC’s fair value.
- Flexible Excel Template: Designed for quick modifications, scenario analysis, and in-depth projections.
- Efficient and Precise: Avoid the hassle of building models from scratch while ensuring accuracy and adaptability.
Key Features
- 🔍 Real-Life NTIC Financials: Pre-filled historical and projected data for Northern Technologies International Corporation (NTIC).
- ✏️ Fully Customizable Inputs: Adjust all critical parameters (yellow cells) like WACC, growth %, and tax rates.
- 📊 Professional DCF Valuation: Built-in formulas calculate NTIC’s intrinsic value using the Discounted Cash Flow method.
- ⚡ Instant Results: Visualize NTIC’s valuation instantly after making changes.
- Scenario Analysis: Test and compare outcomes for various financial assumptions side-by-side.
How It Works
- Download the Template: Gain immediate access to the Excel-based NTIC DCF Calculator.
- Input Your Assumptions: Modify the yellow-highlighted cells for growth rates, WACC, margins, and other parameters.
- Instant Calculations: The model automatically recalculates Northern Technologies' intrinsic value.
- Test Scenarios: Experiment with various assumptions to assess potential valuation fluctuations.
- Analyze and Decide: Utilize the results to inform your investment or financial assessment.
Why Choose Northern Technologies International Corporation (NTIC)?
- Innovative Solutions: Our advanced technologies are at the forefront of the industry.
- Environmental Responsibility: We prioritize sustainable practices in all our operations.
- Proven Track Record: Years of experience and success in delivering quality products and services.
- Customer-Centric Approach: We tailor our offerings to meet the unique needs of our clients.
- Expertise You Can Trust: Our team consists of industry professionals dedicated to excellence.
Who Should Use Northern Technologies International Corporation (NTIC)?
- Investors: Gain insights into sustainable technologies and make informed investment choices.
- Environmental Consultants: Utilize NTIC's innovative solutions for client projects and assessments.
- Industry Analysts: Analyze market trends and performance metrics with comprehensive data from NTIC.
- Business Development Professionals: Leverage NTIC's expertise to identify growth opportunities in the green technology sector.
- Students and Educators: Explore NTIC's role in environmental sustainability as a case study in academic settings.
What the NTIC Template Contains
- Comprehensive DCF Model: Editable template with detailed valuation calculations tailored for Northern Technologies International Corporation (NTIC).
- Real-World Data: NTIC’s historical and projected financials preloaded for in-depth analysis.
- Customizable Parameters: Adjust WACC, growth rates, and tax assumptions to explore various scenarios.
- Financial Statements: Complete annual and quarterly breakdowns for enhanced insights into NTIC's performance.
- Key Ratios: Integrated analysis for profitability, efficiency, and leverage specific to NTIC.
- Dashboard with Visual Outputs: Charts and tables designed for clear, actionable results regarding NTIC's financial health.
Disclaimer
All information, articles, and product details provided on this website are for general informational and educational purposes only. We do not claim any ownership over, nor do we intend to infringe upon, any trademarks, copyrights, logos, brand names, or other intellectual property mentioned or depicted on this site. Such intellectual property remains the property of its respective owners, and any references here are made solely for identification or informational purposes, without implying any affiliation, endorsement, or partnership.
We make no representations or warranties, express or implied, regarding the accuracy, completeness, or suitability of any content or products presented. Nothing on this website should be construed as legal, tax, investment, financial, medical, or other professional advice. In addition, no part of this site—including articles or product references—constitutes a solicitation, recommendation, endorsement, advertisement, or offer to buy or sell any securities, franchises, or other financial instruments, particularly in jurisdictions where such activity would be unlawful.
All content is of a general nature and may not address the specific circumstances of any individual or entity. It is not a substitute for professional advice or services. Any actions you take based on the information provided here are strictly at your own risk. You accept full responsibility for any decisions or outcomes arising from your use of this website and agree to release us from any liability in connection with your use of, or reliance upon, the content or products found herein.