
|
News Corporation (NWS) Évaluation DCF |
Entièrement Modifiable: Adapté À Vos Besoins Dans Excel Ou Sheets
Conception Professionnelle: Modèles Fiables Et Conformes Aux Normes Du Secteur
Pré-Construits Pour Une Utilisation Rapide Et Efficace
Compatible MAC/PC, entièrement débloqué
Aucune Expertise N'Est Requise; Facile À Suivre
News Corporation (NWS) Bundle
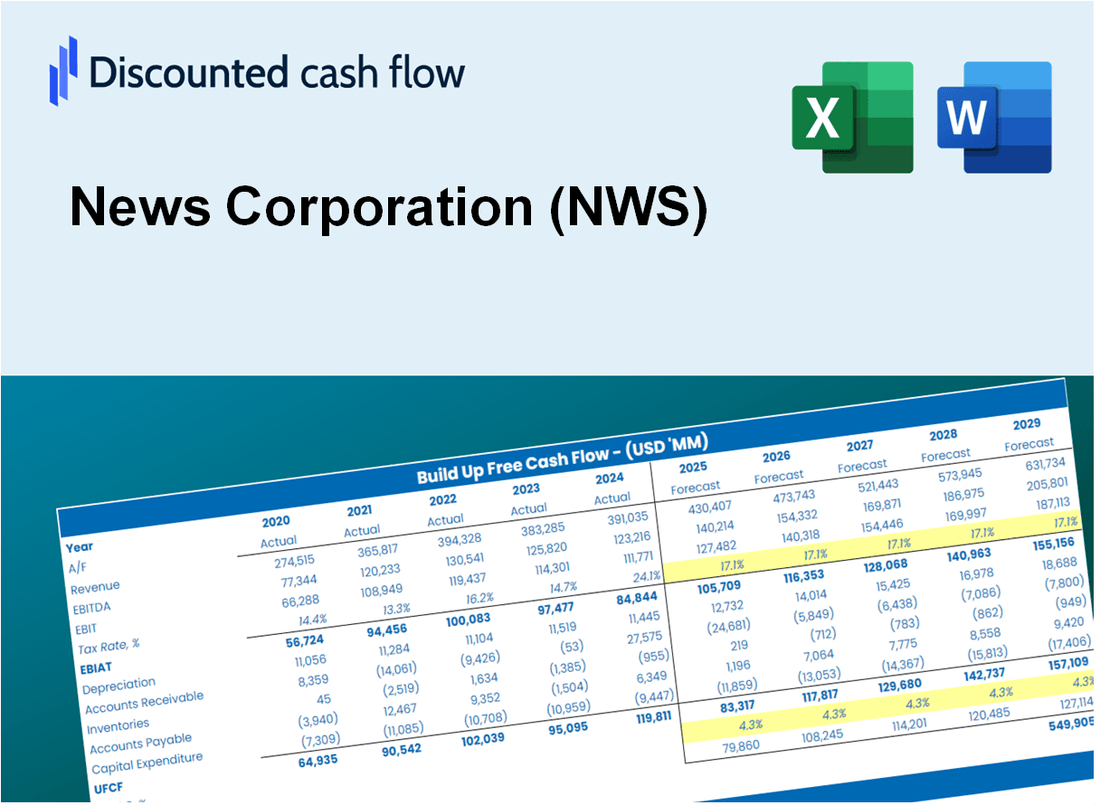
Que vous soyez un investisseur ou un analyste, cette calculatrice DCF (NWS) sert de ressource incontournable pour une évaluation précise. Chargé de données réelles de News Corporation, vous pouvez ajuster les prévisions et observer instantanément les effets.
Discounted Cash Flow (DCF) - (USD MM)
| Year | AY1 2021 |
AY2 2022 |
AY3 2023 |
AY4 2024 |
AY5 2025 |
FY1 2026 |
FY2 2027 |
FY3 2028 |
FY4 2029 |
FY5 2030 |
|---|---|---|---|---|---|---|---|---|---|---|
| Revenue | 9,358.0 | 10,385.0 | 8,012.0 | 8,252.0 | 8,452.0 | 8,315.6 | 8,181.3 | 8,049.3 | 7,919.4 | 7,791.5 |
| Revenue Growth, % | 0 | 10.97 | -22.85 | 3 | 2.42 | -1.61 | -1.61 | -1.61 | -1.61 | -1.61 |
| EBITDA | 1,036.0 | 1,418.0 | 878.0 | 970.0 | 1,134.0 | 1,012.1 | 995.8 | 979.7 | 963.9 | 948.3 |
| EBITDA, % | 11.07 | 13.65 | 10.96 | 11.75 | 13.42 | 12.17 | 12.17 | 12.17 | 12.17 | 12.17 |
| Depreciation | 430.0 | 425.0 | 200.0 | 188.0 | 178.0 | 258.9 | 254.7 | 250.6 | 246.6 | 242.6 |
| Depreciation, % | 4.59 | 4.09 | 2.5 | 2.28 | 2.11 | 3.11 | 3.11 | 3.11 | 3.11 | 3.11 |
| EBIT | 606.0 | 993.0 | 678.0 | 782.0 | 956.0 | 753.2 | 741.0 | 729.1 | 717.3 | 705.7 |
| EBIT, % | 6.48 | 9.56 | 8.46 | 9.48 | 11.31 | 9.06 | 9.06 | 9.06 | 9.06 | 9.06 |
| Total Cash | 2,236.0 | 1,822.0 | 1,833.0 | 1,872.0 | 2,403.0 | 1,919.8 | 1,888.8 | 1,858.3 | 1,828.3 | 1,798.8 |
| Total Cash, percent | .0 | .0 | .0 | .0 | .0 | .0 | .0 | .0 | .0 | .0 |
| Account Receivables | 1,498.0 | 1,502.0 | 1,425.0 | 1,420.0 | 1,562.0 | 1,396.1 | 1,373.6 | 1,351.4 | 1,329.6 | 1,308.1 |
| Account Receivables, % | 16.01 | 14.46 | 17.79 | 17.21 | 18.48 | 16.79 | 16.79 | 16.79 | 16.79 | 16.79 |
| Inventories | 253.0 | 311.0 | 311.0 | 266.0 | 327.0 | 277.3 | 272.8 | 268.4 | 264.1 | 259.8 |
| Inventories, % | 2.7 | 2.99 | 3.88 | 3.22 | 3.87 | 3.33 | 3.33 | 3.33 | 3.33 | 3.33 |
| Accounts Payable | 321.0 | 411.0 | 440.0 | 254.0 | 335.0 | 331.3 | 326.0 | 320.7 | 315.5 | 310.4 |
| Accounts Payable, % | 3.43 | 3.96 | 5.49 | 3.08 | 3.96 | 3.98 | 3.98 | 3.98 | 3.98 | 3.98 |
| Capital Expenditure | -390.0 | -499.0 | -499.0 | -357.0 | -407.0 | -404.8 | -398.3 | -391.9 | -385.6 | -379.3 |
| Capital Expenditure, % | -4.17 | -4.81 | -6.23 | -4.33 | -4.82 | -4.87 | -4.87 | -4.87 | -4.87 | -4.87 |
| Tax Rate, % | -27.84 | -27.84 | -27.84 | -27.84 | -27.84 | -27.84 | -27.84 | -27.84 | -27.84 | -27.84 |
| EBITAT | 444.4 | 761.9 | 265.8 | 355.6 | 1,222.2 | 504.2 | 496.1 | 488.1 | 480.2 | 472.5 |
| Depreciation | ||||||||||
| Changes in Account Receivables | ||||||||||
| Changes in Inventories | ||||||||||
| Changes in Accounts Payable | ||||||||||
| Capital Expenditure | ||||||||||
| UFCF | -945.6 | 715.9 | 72.8 | 50.6 | 871.2 | 570.2 | 374.2 | 368.1 | 362.2 | 356.4 |
| WACC, % | 7.49 | 7.51 | 7.3 | 7.34 | 7.64 | 7.45 | 7.45 | 7.45 | 7.45 | 7.45 |
| PV UFCF | ||||||||||
| SUM PV UFCF | 1,671.9 | |||||||||
| Long Term Growth Rate, % | 2.00 | |||||||||
| Free cash flow (T + 1) | 363 | |||||||||
| Terminal Value | 6,664 | |||||||||
| Present Terminal Value | 4,652 | |||||||||
| Enterprise Value | 6,324 | |||||||||
| Net Debt | 537 | |||||||||
| Equity Value | 5,787 | |||||||||
| Diluted Shares Outstanding, MM | 570 | |||||||||
| Equity Value Per Share | 10.15 |
What You Will Get
- Real NWS Financial Data: Pre-filled with News Corporation’s historical and projected data for precise analysis.
- Fully Editable Template: Modify key inputs like revenue growth, WACC, and EBITDA % with ease.
- Automatic Calculations: See News Corporation’s intrinsic value update instantly based on your changes.
- Professional Valuation Tool: Designed for investors, analysts, and consultants seeking accurate DCF results.
- User-Friendly Design: Simple structure and clear instructions for all experience levels.
Key Features
- Comprehensive Historical Data: News Corporation’s (NWS) detailed financial statements and historical performance metrics.
- Customizable Assumptions: Modify WACC, tax rates, revenue growth projections, and EBITDA margins to fit your analysis.
- Real-Time Valuation: Instantly view the recalculated intrinsic value of News Corporation (NWS) as you adjust inputs.
- Intuitive Visualizations: Interactive dashboard charts present valuation outcomes and essential financial metrics.
- Engineered for Precision: A robust tool designed for analysts, investors, and finance professionals.
How It Works
- Step 1: Download the Excel file.
- Step 2: Review pre-entered News Corporation (NWS) data (historical and projected).
- Step 3: Adjust key assumptions (yellow cells) based on your analysis.
- Step 4: View automatic recalculations for News Corporation’s (NWS) intrinsic value.
- Step 5: Use the outputs for investment decisions or reporting.
Why Choose This Calculator for News Corporation (NWS)?
- Accuracy: Utilizes real News Corporation financials to ensure precise data.
- Flexibility: Allows users to easily test and adjust inputs as needed.
- Time-Saving: Eliminate the need to create a DCF model from the ground up.
- Professional-Grade: Crafted with the expertise and usability expected by CFOs.
- User-Friendly: Intuitive interface suitable for users with varying levels of financial modeling skills.
Who Should Use This Product?
- Journalism Students: Explore media analysis techniques and apply them to real-world case studies.
- Academics: Utilize industry-standard models in your courses or research projects.
- Media Investors: Evaluate your investment strategies and assess valuation results for News Corporation (NWS).
- Market Analysts: Enhance your efficiency with a ready-to-use, customizable financial model.
- Content Creators: Understand how major media corporations like News Corporation (NWS) operate and are evaluated.
What the Template Contains
- Operating and Balance Sheet Data: Pre-filled News Corporation (NWS) historical data and forecasts, including revenue, EBITDA, EBIT, and capital expenditures.
- WACC Calculation: A dedicated sheet for Weighted Average Cost of Capital (WACC), including parameters like Beta, risk-free rate, and share price.
- DCF Valuation (Unlevered and Levered): Editable Discounted Cash Flow models showing intrinsic value with detailed calculations.
- Financial Statements: Pre-loaded financial statements (annual and quarterly) to support analysis.
- Key Ratios: Includes profitability, leverage, and efficiency ratios for News Corporation (NWS).
- Dashboard and Charts: Visual summary of valuation outputs and assumptions to analyze results easily.
Disclaimer
All information, articles, and product details provided on this website are for general informational and educational purposes only. We do not claim any ownership over, nor do we intend to infringe upon, any trademarks, copyrights, logos, brand names, or other intellectual property mentioned or depicted on this site. Such intellectual property remains the property of its respective owners, and any references here are made solely for identification or informational purposes, without implying any affiliation, endorsement, or partnership.
We make no representations or warranties, express or implied, regarding the accuracy, completeness, or suitability of any content or products presented. Nothing on this website should be construed as legal, tax, investment, financial, medical, or other professional advice. In addition, no part of this site—including articles or product references—constitutes a solicitation, recommendation, endorsement, advertisement, or offer to buy or sell any securities, franchises, or other financial instruments, particularly in jurisdictions where such activity would be unlawful.
All content is of a general nature and may not address the specific circumstances of any individual or entity. It is not a substitute for professional advice or services. Any actions you take based on the information provided here are strictly at your own risk. You accept full responsibility for any decisions or outcomes arising from your use of this website and agree to release us from any liability in connection with your use of, or reliance upon, the content or products found herein.