
|
Quanex Building Products Corporation (NX): Analyse SWOT [Jan-2025 Mise à jour] |
Entièrement Modifiable: Adapté À Vos Besoins Dans Excel Ou Sheets
Conception Professionnelle: Modèles Fiables Et Conformes Aux Normes Du Secteur
Pré-Construits Pour Une Utilisation Rapide Et Efficace
Compatible MAC/PC, entièrement débloqué
Aucune Expertise N'Est Requise; Facile À Suivre
Quanex Building Products Corporation (NX) Bundle
Dans le paysage dynamique de la fabrication de produits de construction, Quanex Building Products Corporation (NX) se tient à un moment critique, naviguant des défis du marché complexes et des opportunités prometteuses. Cette analyse SWOT complète révèle le positionnement stratégique de l'entreprise, dépliant une image nuancée de ses forces concurrentielles, des vulnérabilités potentielles, des opportunités de marché émergentes et des menaces critiques qui pourraient façonner sa trajectoire future dans le 50 milliards de dollars Industrie des composants de construction. Plongez profondément dans une exploration perspicace de la façon dont Quanex manœuvrait stratégiquement pour maintenir sa pertinence sur le marché et stimuler la croissance durable dans un secteur de plus en plus compétitif et axé sur la technologie.
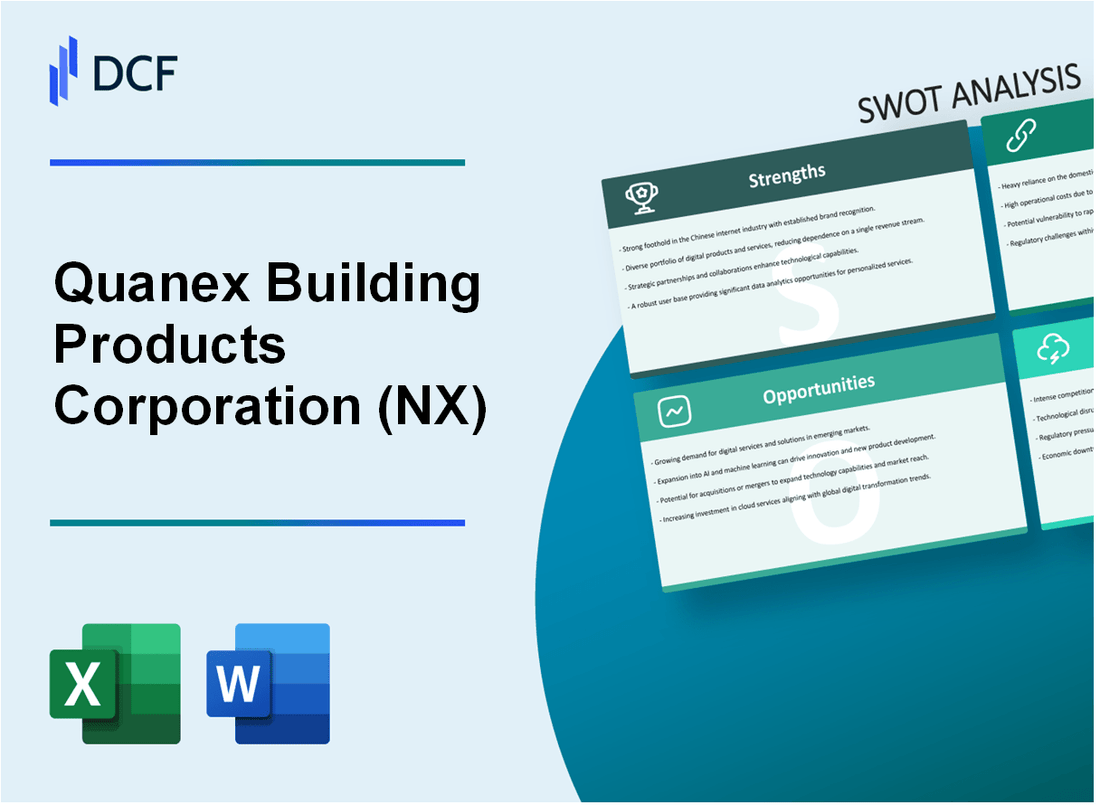
Quanex Building Products Corporation (NX) - Analyse SWOT: Forces
Fabricant spécialisé de composants de fenêtre et de porte d'ingénierie
Quanex Building Products Corporation opère avec une capitalisation boursière de 685,3 millions de dollars au quatrième trimestre 2023. La société est spécialisée dans les composants de construction de précision avec une gamme de produits ciblés.
| Segment de marché | Spécialisation des produits | Part de marché |
|---|---|---|
| Composants de fenêtre | Extrusions en vinyle et en aluminium | Environ 18% du marché nord-américain |
| Composants de la porte | Cadres d'ingénierie de précision | Environ 15% du marché nord-américain |
Portfolio de produits diversifié
La société dessert plusieurs segments de marché de la construction avec une gamme de produits robuste.
- Construction résidentielle: 62% des revenus totaux
- Construction commerciale: 38% des revenus totaux
- Lignes de produit: composants de fenêtre, composants de porte, extrusions architecturales
Réputation établie de fabrication de qualité
Quanex entretient des normes de fabrication élevées avec des investissements importants dans la technologie et le contrôle de la qualité.
| Métrique manufacturière | Performance |
|---|---|
| Installations de fabrication | 12 emplacements à travers l'Amérique du Nord |
| Certifications de qualité | ISO 9001: 2015 certifié |
| Investissement en R&D | 22,3 millions de dollars par an |
Performance financière cohérente
Quanex démontre des mesures financières stables sur plusieurs années.
| Métrique financière | 2022 Performance | Performance de 2023 |
|---|---|---|
| Revenus annuels | 1,12 milliard de dollars | 1,18 milliard de dollars |
| Revenu net | 78,5 millions de dollars | 82,3 millions de dollars |
| Marge brute | 28.6% | 29.4% |
Équipe de gestion expérimentée
Équipe de direction avec une vaste expérience de l'industrie et une vision stratégique.
- Temps de gestion moyen: 14,7 ans dans l'industrie des produits de construction
- Équipe de direction avec plus de 85 ans d'expérience de fabrication
- Positions en leadership occupées par des anciens combattants de l'industrie avec des antécédents éprouvés
Quanex Building Products Corporation (NX) - Analyse SWOT: faiblesses
Vulnérabilité aux fluctuations du marché cyclique de la construction et du logement
Quanex Building Products Corporation fait face à une exposition importante à la volatilité du marché de la construction. Au quatrième trimestre 2023, les départs du logement américain étaient de 1,56 million d'unités, ce qui représente une baisse de 4,1% par rapport aux trimestres précédents. Les revenus de l'entreprise sont directement touchés par ces fluctuations du marché.
| Indicateur de marché | Valeur 2023 | Impact sur Quanex |
|---|---|---|
| Le logement américain commence | 1,56 million d'unités | -4,1% de baisse trimestrielle |
| Indice de volatilité du marché de la construction | 62.3 | Sensibilité élevée |
Capitalisation boursière relativement petite
En janvier 2024, la capitalisation boursière de Quanex s'élève à environ 815 millions de dollars, nettement plus faible par rapport aux géants de l'industrie.
| Entreprise | Capitalisation boursière | Comparaison |
|---|---|---|
| Produits de construction Quanex | 815 millions de dollars | Segment de petite capitalisation |
| Masco Corporation | 12,3 milliards de dollars | 15x plus grand |
Dépendances de la chaîne d'approvisionnement et volatilité des coûts des matières premières
Les coûts des matières premières ont un impact significatif sur l'efficacité opérationnelle de Quanex. Les principaux défis incluent:
- Les prix de l'aluminium ont fluctué de 22,7% en 2023
- Les coûts des intrants en acier ont augmenté de 15,4%
- Volatilité des prix en résine en polymère de 18,3%
Diversification géographique limitée
Quanex opère principalement sur les marchés nord-américains, avec 92.6% des revenus générés aux États-Unis.
| Distribution des revenus géographiques | Pourcentage |
|---|---|
| États-Unis | 92.6% |
| Canada | 5.4% |
| Marchés internationaux | 2% |
Contraintes de dépenses en capital
Les limitations technologiques des investissements sont évidentes dans la stratégie de dépenses en capital de Quanex. En 2023, la société a investi 42,3 millions de dollars dans les améliorations des capitaux, qui ne représente que 5.2% des revenus annuels.
- Capex annuel: 42,3 millions de dollars
- Capex en pourcentage de revenus: 5,2%
- Dépenses de R&D: 12,7 millions de dollars (2,1% des revenus)
Quanex Building Products Corporation (NX) - Analyse SWOT: Opportunités
Demande croissante de composants de fenêtre et de porte économes en énergie dans la construction durable
Le marché américain des matériaux de construction verte devrait atteindre 573,9 milliards de dollars d'ici 2027, avec un TCAC de 11,4%. Les produits de construction Quanex peuvent capitaliser sur cette tendance grâce à ses offres de composants économes en énergie.
| Segment de marché | Croissance projetée (2024-2027) |
|---|---|
| Composants de fenêtre économes en énergie | 14,2% CAGR |
| Systèmes de portes durables | 12,7% CAGR |
Expansion potentielle dans les matériaux et technologies de construction verts émergents
Les technologies émergentes clés présentent des opportunités de marché importantes:
- Technologies de fenêtre intelligents avec contrôle thermique dynamique
- Matériaux de construction composites recyclables
- Processus de fabrication à faible teneur en carbone
Activité de construction résidentielle et commerciale croissante aux États-Unis
Les indicateurs du marché de la construction montrent un potentiel de croissance prometteur:
| Secteur de la construction | 2024 Croissance projetée |
|---|---|
| Construction résidentielle | 4.3% |
| Construction commerciale | 5.1% |
Opportunités d'acquisitions stratégiques pour améliorer les capacités des produits
Les objectifs d'acquisition potentiels comprennent:
- Fabricants de composants spécialisés
- Entreprises de technologie des matériaux avancés
- Sociétés de technologie d'isolation innovante
Potentiel d'innovation technologique dans la fabrication de composants de construction
Domaines d'investissement pour l'innovation technologique:
- Impression 3D des composants de construction
- Optimisation de la fabrication dirigée par l'IA
- Technologies de barrière thermique avancées
| Zone d'innovation | Investissement estimé en R&D |
|---|---|
| Technologies de fabrication avancées | 12,5 millions de dollars |
| Recherche en science du matériel | 8,3 millions de dollars |
Quanex Building Products Corporation (NX) - Analyse SWOT: menaces
Concurrence intense dans le secteur de la fabrication de produits de construction
Quanex fait face à des pressions concurrentielles importantes dans l'industrie de la fabrication de produits de construction. Le paysage du marché révèle les mesures concurrentielles suivantes:
| Concurrent | Part de marché | Revenus annuels |
|---|---|---|
| Masco Corporation | 12.5% | 8,2 milliards de dollars |
| Builders FirstSource | 10.3% | 7,6 milliards de dollars |
| PLI | 7.8% | 5,4 milliards de dollars |
Ralentissements économiques potentiels affectant les marchés de la construction et du logement
Les indicateurs économiques suggèrent des risques potentiels sur les marchés de la construction:
- Les départs de logement ont diminué de 4,3% en 2023
- Investissement en construction résidentielle prévu pour diminuer 2,1% en 2024
- Les taux d'intérêt hypothécaire restent supérieurs à 6,5%
Augmentation des coûts des matières premières et des perturbations de la chaîne d'approvisionnement
Les tendances du coût des matières premières présentent des défis importants:
| Matériel | Augmentation des prix (2023) | Augmentation projetée (2024) |
|---|---|---|
| Aluminium | 8.7% | 5.2% |
| Acier | 6.5% | 4.9% |
| Résines en plastique | 7.3% | 4.6% |
Règlements environnementales strictes
Les coûts de conformité environnementale augmentent:
- Coûts de conformité réglementaire de l'EPA estimés à 2,3 millions de dollars par an
- Les émissions de carbone indiquent les exigences croissantes
- Les implications potentielles de l'impôt sur le carbone se situent entre 1,5 et 2,7 millions de dollars
Perturbations technologiques potentielles
Les risques de transformation technologique comprennent:
- Technologie d'impression 3D Perturbation du marché potentiel: 12,5% de part de marché potentiel
- Investissement avancé de recherche sur les matériaux composites: 450 millions de dollars à l'échelle de l'industrie
- Les technologies de matériaux de construction durables émergentes augmentent à 7,2% par an
Quanex Building Products Corporation (NX) - SWOT Analysis: Opportunities
Capitalize on secular trends toward energy-efficient building products in North America and Europe.
The most significant near-term opportunity for Quanex Building Products Corporation (NX) is the accelerating demand for energy-efficient building envelope solutions, driven by tightening government regulations and rising utility costs. The global green buildings market is a massive tailwind, estimated to be worth $618.58 billion in 2025. Europe, a key market for Quanex, is leading this charge; its green buildings market alone is estimated at $241.25 billion in 2025. This is a clear runway for your high-performance insulating glass (IG) spacers and vinyl profiles.
The broader energy-efficient building market is projected to grow at a Compound Annual Growth Rate (CAGR) of 7.6% to reach $145.84 billion in 2025, with Europe being the largest market. Your focus should be on leveraging the Tyman acquisition, which significantly expanded your European presence, to capture a larger share of this regulatory-driven demand.
Further debt reduction, with the Debt Covenant Leverage Ratio already down to 2.4x as of July 31, 2025.
Your disciplined capital allocation is creating a major financial opportunity. Reducing your leverage ratio (Net Debt to LTM Adjusted EBITDA) is critical for financial flexibility, and the progress is clear: the Debt Covenant Leverage Ratio stood at a healthy 2.4x as of July 31, 2025, following the Tyman acquisition. This is defintely a strong position.
In the third quarter of fiscal 2025 alone, the company repaid $51.25 million in bank debt. This debt reduction, combined with the projected full-year 2025 Adjusted EBITDA guidance of approximately $235 million, means you have a clear path to generating free cash flow for further deleveraging or strategic investments. Here's the quick math on the synergy boost:
- Tyman Acquisition Cost Synergy Target: Increased to approximately $45 million (up from the original $30 million target).
- Projected FY2025 Net Sales: Approximately $1.82 billion.
Leverage material science expertise to expand into adjacent markets like solar and refrigeration components.
Quanex's core strength is its material science expertise-the ability to engineer polymers and metals for performance. This capability is your entry ticket into high-growth adjacent markets. The company is already collaborating with leading Original Equipment Manufacturers (OEMs) in solar and refrigeration, and these markets are expanding rapidly, fueled by the same energy-efficiency trends driving your core business.
The global solar Photovoltaic (PV) panels market is expected to reach $198.91 billion in 2025, with installations projected to grow by 10% to 655 GW in 2025. Similarly, the global refrigeration components market is forecast to reach $22.46 billion in 2025, growing at a 6.03% CAGR, while the commercial refrigeration market is growing at a 6.6% CAGR. This presents a chance to diversify revenue beyond the cyclical nature of residential new construction.
Long-term demand tailwinds from housing deficits and needed renovation activity.
The long-term fundamentals for your products are solid, despite near-term housing market softness due to high interest rates. In the US, there is an estimated need to catch up on about two million housing units that were under-built over the last decade. Plus, the existing housing stock is aging.
The renovation market is a massive, resilient opportunity. The pool of 'eligible' homes for remodeling is expected to grow 2-3x higher than 2019 levels by 2025, creating a significant backlog of deferred window and door replacement projects. In Europe, the residential construction market is estimated at $1.40 trillion in 2025, and the renovation segment is forecast to expand at a 4.31% CAGR through 2030. This is a huge market that needs your energy-efficient components.
| Market Segment | 2025 Market Size / Key Metric | Growth Driver |
|---|---|---|
| Global Green Buildings Market | Estimated $618.58 billion in 2025 | EU Renovation Wave, US legislative support for green building standards. |
| Europe Home Improvement Market (Renovation) | Estimated $116.70 billion in 2025 | Energy-efficient renovations account for nearly 25% of all projects. |
| Global Solar PV Panels Market | Expected to reach $198.91 billion in 2025 | 9.66% CAGR (2025-2034); Global push for clean energy. |
| Global Refrigeration Components Market | Expected to reach $22.46 billion in 2025 | 6.03% CAGR; Demand for energy-efficient, eco-friendly systems. |
| US Housing Deficit | Estimated need to catch up on two million housing units | Decade of underbuilding post-2008 financial crisis. |
Quanex Building Products Corporation (NX) - SWOT Analysis: Threats
Macroeconomic headwinds causing weaker demand for new construction and repair-and-remodel activity.
You're seeing the impact of higher interest rates and persistent inflation hit the construction sector hard, and Quanex Building Products Corporation is no exception. The core threat here is that elevated borrowing costs are suppressing demand for new housing and large-scale repair-and-remodel (R&R) projects. The National Association of Home Builders' Housing Market Index (HMI) for April 2025 was at 40, which is a clear signal of pessimism among builders, since anything below 50 indicates a contracting market. This is a direct threat to Quanex's volumes.
Plus, input costs remain high. While material price inflation has eased slightly, new tariffs on imports and ongoing global supply chain volatility could reignite cost pressures into 2026. The industry also needs to hire over 720,000 skilled workers in 2025 just to keep up with demand, which means labor costs will stay elevated. This combination of soft demand and high operating costs is a tough squeeze.
Revised FY2025 Adjusted EBITDA guidance is lower at approximately $235 million, reflecting market softness.
The clearest sign of market softness hitting the bottom line is Quanex Building Products Corporation's revised financial outlook. The company initially guided for a much stronger fiscal year 2025, but they have since had to walk that back. The latest guidance, updated in September 2025, projects full-year Adjusted EBITDA (Earnings Before Interest, Taxes, Depreciation, and Amortization) to be approximately $235 million. This downward revision directly reflects the impact of lower-than-anticipated volumes and slower synergy capture in the second half of the year.
Here's the quick math on the shift: the previous guidance range was $270 million to $280 million. Dropping to $235 million is a significant cut, signaling that the expected seasonal uptick in the spring and summer of 2025 simply didn't materialize to the degree management had hoped for. This tells you the market is defintely weaker than expected.
Integration risk remains; the Tyman acquisition is proving harder to integrate than initially expected.
The Tyman acquisition, while strategically sound for scale, has introduced significant operational risk and volatility in 2025. The integration is proving more complex than initially forecast, particularly in the Hardware Solutions segment. A major issue surfaced in Q3 2025 with operational problems at the Tyman Mexico facility, which management attributed to suboptimal tooling and equipment conditions. This single issue created an approximate $5 million EBITDA headwind in Q3 2025 alone.
What this estimate hides is the broader disruption and loss of investor confidence. Furthermore, the company recorded a substantial $302 million goodwill impairment charge in Q1 2025, which, while non-cash, raises serious questions about the long-term value and initial valuation of the acquired Tyman assets. While the cost synergy target was increased to approximately $45 million, the immediate operational setbacks show the difficulty in capturing those synergies quickly.
- Operational issues in Mexico caused $5 million Q3 2025 EBITDA loss.
- $302 million goodwill impairment charge recorded in Q1 2025.
- Procurement synergies were lower than expected, slowing value capture.
Competitive pressures from larger industry players like Builders FirstSource and Masco.
Quanex Building Products Corporation operates in a market where scale is a massive advantage, and its competitors dwarf its size. The primary threat comes from industry giants like Builders FirstSource, which is the largest U.S. supplier of building products to the professional market. This immense scale allows competitors to negotiate better raw material prices, invest more in technology, and offer a broader, more integrated solution to homebuilders.
To put the scale difference into perspective, compare the 2025 financial outlooks:
| Company | FY2025 Net Sales Outlook | FY2025 Adjusted EBITDA Outlook |
|---|---|---|
| Builders FirstSource | $14.8 billion to $15.6 billion | $1.5 billion to $1.7 billion |
| Quanex Building Products Corporation | Approximately $1.82 billion | Approximately $235 million |
The sheer difference in revenue-Builders FirstSource is projecting over 8 times Quanex's net sales-means Quanex is constantly fighting a battle against larger, more financially powerful companies that can absorb market downturns and price aggressively. Masco Corporation also presents a threat by offering a comprehensive suite of branded building and home improvement products, often controlling more of the value chain than Quanex.
Next Step: Operations: Develop a 90-day action plan to resolve the Tyman Mexico facility's tooling and equipment issues by the end of Q4 2025.
Disclaimer
All information, articles, and product details provided on this website are for general informational and educational purposes only. We do not claim any ownership over, nor do we intend to infringe upon, any trademarks, copyrights, logos, brand names, or other intellectual property mentioned or depicted on this site. Such intellectual property remains the property of its respective owners, and any references here are made solely for identification or informational purposes, without implying any affiliation, endorsement, or partnership.
We make no representations or warranties, express or implied, regarding the accuracy, completeness, or suitability of any content or products presented. Nothing on this website should be construed as legal, tax, investment, financial, medical, or other professional advice. In addition, no part of this site—including articles or product references—constitutes a solicitation, recommendation, endorsement, advertisement, or offer to buy or sell any securities, franchises, or other financial instruments, particularly in jurisdictions where such activity would be unlawful.
All content is of a general nature and may not address the specific circumstances of any individual or entity. It is not a substitute for professional advice or services. Any actions you take based on the information provided here are strictly at your own risk. You accept full responsibility for any decisions or outcomes arising from your use of this website and agree to release us from any liability in connection with your use of, or reliance upon, the content or products found herein.