
|
Nexgel, Inc. (NXGL) Évaluation DCF |
Entièrement Modifiable: Adapté À Vos Besoins Dans Excel Ou Sheets
Conception Professionnelle: Modèles Fiables Et Conformes Aux Normes Du Secteur
Pré-Construits Pour Une Utilisation Rapide Et Efficace
Compatible MAC/PC, entièrement débloqué
Aucune Expertise N'Est Requise; Facile À Suivre
NEXGEL, Inc. (NXGL) Bundle
Découvrez la véritable valeur de Nexgel, Inc. avec notre calculatrice avancée DCF! Ajustez les hypothèses clés, explorez divers scénarios et évaluez comment les changements influencent Nexgel, Inc. (NXGL) - le tout dans un modèle Excel pratique.
What You Will Get
- Editable Forecast Inputs: Seamlessly adjust key assumptions (growth %, margins, WACC) to explore various scenarios.
- Real-World Data: NEXGEL, Inc.’s (NXGL) financial data pre-loaded to streamline your analysis.
- Automatic DCF Outputs: The template computes Net Present Value (NPV) and intrinsic value automatically.
- Customizable and Professional: A sleek Excel model that caters to your valuation requirements.
- Built for Analysts and Investors: Perfect for evaluating projections, validating strategies, and enhancing efficiency.
Key Features
- 🔍 Real-Life NXGL Financials: Pre-filled historical and projected data for NEXGEL, Inc.
- ✏️ Fully Customizable Inputs: Adjust all critical parameters (yellow cells) like WACC, growth %, and tax rates.
- 📊 Professional DCF Valuation: Built-in formulas calculate NEXGEL’s intrinsic value using the Discounted Cash Flow method.
- ⚡ Instant Results: Visualize NEXGEL’s valuation instantly after making changes.
- Scenario Analysis: Test and compare outcomes for various financial assumptions side-by-side.
How It Works
- Download the Template: Gain immediate access to the Excel-based NEXGEL, Inc. (NXGL) DCF Calculator.
- Input Your Assumptions: Modify the yellow-highlighted cells for growth rates, WACC, margins, and additional parameters.
- Instant Calculations: The model automatically recalculates NEXGEL, Inc.'s (NXGL) intrinsic value.
- Test Scenarios: Experiment with various assumptions to assess potential valuation impacts.
- Analyze and Decide: Utilize the findings to inform your investment or financial analysis decisions.
Why Choose NEXGEL, Inc. (NXGL)?
- Innovative Solutions: Cutting-edge technology that enhances product performance and user experience.
- Proven Quality: High standards ensure reliable and effective products for all applications.
- Tailored Offerings: Customizable products to meet specific industry needs and customer requirements.
- User-Friendly Design: Intuitive interfaces and clear instructions facilitate easy adoption and use.
- Industry Recognition: Endorsed by professionals for excellence in innovation and service.
Who Should Use NEXGEL, Inc. (NXGL)?
- Healthcare Professionals: Understand the applications of hydrogel technology in patient care and treatment.
- Researchers: Explore innovative uses of NEXGEL's products in scientific studies and experiments.
- Investors: Evaluate market potential and performance metrics related to NEXGEL, Inc. (NXGL).
- Manufacturers: Integrate NEXGEL's advanced materials into your production processes for enhanced product offerings.
- Entrepreneurs: Discover business opportunities in the growing field of biocompatible materials and their applications.
What the Template Contains
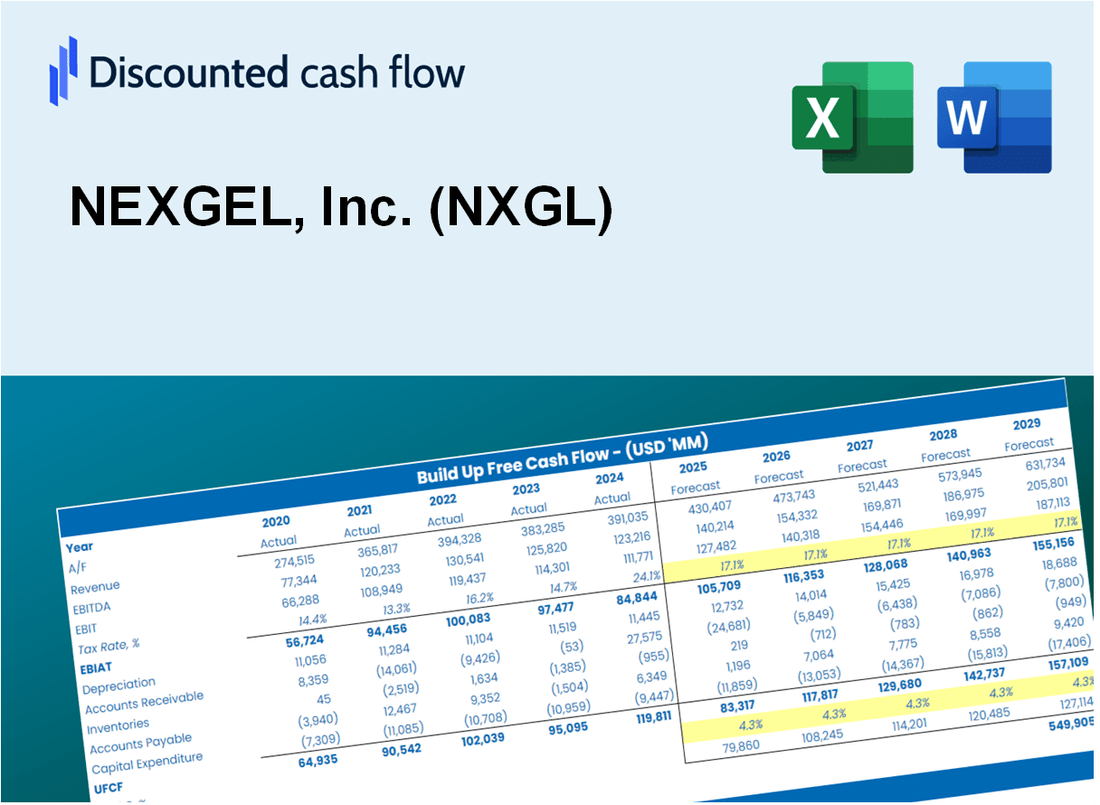
- Operating and Balance Sheet Data: Pre-filled NEXGEL, Inc. (NXGL) historical data and forecasts, including revenue, EBITDA, EBIT, and capital expenditures.
- WACC Calculation: A dedicated sheet for Weighted Average Cost of Capital (WACC), including parameters like Beta, risk-free rate, and share price.
- DCF Valuation (Unlevered and Levered): Editable Discounted Cash Flow models showing intrinsic value with detailed calculations.
- Financial Statements: Pre-loaded financial statements (annual and quarterly) to support analysis.
- Key Ratios: Includes profitability, leverage, and efficiency ratios for NEXGEL, Inc. (NXGL).
- Dashboard and Charts: Visual summary of valuation outputs and assumptions to analyze results easily.
Disclaimer
All information, articles, and product details provided on this website are for general informational and educational purposes only. We do not claim any ownership over, nor do we intend to infringe upon, any trademarks, copyrights, logos, brand names, or other intellectual property mentioned or depicted on this site. Such intellectual property remains the property of its respective owners, and any references here are made solely for identification or informational purposes, without implying any affiliation, endorsement, or partnership.
We make no representations or warranties, express or implied, regarding the accuracy, completeness, or suitability of any content or products presented. Nothing on this website should be construed as legal, tax, investment, financial, medical, or other professional advice. In addition, no part of this site—including articles or product references—constitutes a solicitation, recommendation, endorsement, advertisement, or offer to buy or sell any securities, franchises, or other financial instruments, particularly in jurisdictions where such activity would be unlawful.
All content is of a general nature and may not address the specific circumstances of any individual or entity. It is not a substitute for professional advice or services. Any actions you take based on the information provided here are strictly at your own risk. You accept full responsibility for any decisions or outcomes arising from your use of this website and agree to release us from any liability in connection with your use of, or reliance upon, the content or products found herein.