
|
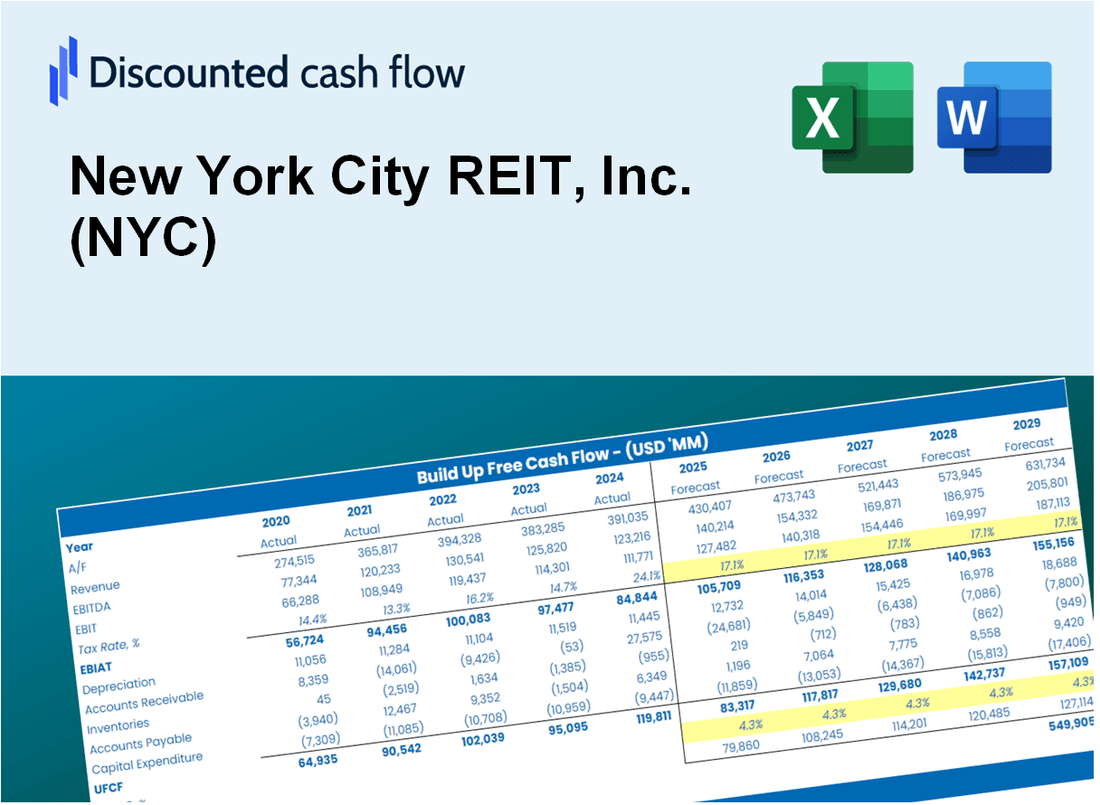
New York City Reit, Inc. (NYC) Valation DCF |
Entièrement Modifiable: Adapté À Vos Besoins Dans Excel Ou Sheets
Conception Professionnelle: Modèles Fiables Et Conformes Aux Normes Du Secteur
Pré-Construits Pour Une Utilisation Rapide Et Efficace
Compatible MAC/PC, entièrement débloqué
Aucune Expertise N'Est Requise; Facile À Suivre
New York City REIT, Inc. (NYC) Bundle
Que vous soyez un investisseur ou un analyste, cette calculatrice DCF (NYC) est votre ressource incontournable pour une évaluation précise. Préchargé avec des données réelles de New York City REIT, Inc., vous pouvez ajuster les prévisions et observer instantanément les effets.
What You Will Get
- Authentic NYC Financial Data: Pre-populated with New York City REIT, Inc.'s historical and projected figures for accurate evaluation.
- Completely Customizable Template: Easily adjust essential inputs such as revenue growth, WACC, and EBITDA %.
- Instant Calculations: Watch New York City REIT, Inc.'s intrinsic value refresh immediately as you make changes.
- Expert Valuation Tool: Tailored for investors, analysts, and consultants aiming for precise DCF outcomes.
- Intuitive Design: Organized layout and straightforward instructions suitable for all skill levels.
Key Features
- 🔍 Real-Life NYC Financials: Pre-filled historical and projected data for New York City REIT, Inc. (NYC).
- ✏️ Fully Customizable Inputs: Adjust all critical parameters (yellow cells) like WACC, growth %, and tax rates.
- 📊 Professional DCF Valuation: Built-in formulas calculate NYC’s intrinsic value using the Discounted Cash Flow method.
- ⚡ Instant Results: Visualize NYC’s valuation instantly after making changes.
- Scenario Analysis: Test and compare outcomes for various financial assumptions side-by-side.
How It Works
- Download the Template: Gain immediate access to the Excel-based NYC DCF Calculator.
- Input Your Assumptions: Modify the yellow-highlighted cells for growth rates, WACC, margins, and other parameters.
- Instant Calculations: The model automatically recalculates New York City REIT, Inc.'s intrinsic value.
- Test Scenarios: Experiment with various assumptions to assess potential changes in valuation.
- Analyze and Decide: Leverage the results to inform your investment or financial analysis.
Why Choose This Calculator for New York City REIT, Inc. (NYC)?
- Precision: Utilizes authentic New York City REIT financials for reliable data.
- Adaptability: Crafted for users to easily experiment and adjust inputs.
- Efficiency: Avoid the complexities of constructing a DCF model from the ground up.
- Expert-Level: Designed with the accuracy and functionality expected by CFOs.
- Accessible: Intuitive interface, suitable for users with varying levels of financial expertise.
Who Should Use New York City REIT, Inc. (NYC)?
- Real Estate Students: Explore investment strategies and apply them to real estate data.
- Academics: Utilize advanced real estate models in your courses or research projects.
- Investors: Validate your investment hypotheses and evaluate the performance of NYC's real estate portfolio.
- Analysts: Enhance your analysis with a customizable model tailored for real estate investments.
- Property Managers: Understand how publicly traded REITs like NYC assess and manage their assets.
What the Template Contains
- Pre-Filled Data: Includes New York City REIT, Inc.'s (NYC) historical financials and forecasts.
- Discounted Cash Flow Model: Editable DCF valuation model with automatic calculations.
- Weighted Average Cost of Capital (WACC): A dedicated sheet for calculating WACC based on custom inputs.
- Key Financial Ratios: Analyze New York City REIT, Inc.'s (NYC) profitability, efficiency, and leverage.
- Customizable Inputs: Edit revenue growth, margins, and tax rates with ease.
- Clear Dashboard: Charts and tables summarizing key valuation results.
Disclaimer
All information, articles, and product details provided on this website are for general informational and educational purposes only. We do not claim any ownership over, nor do we intend to infringe upon, any trademarks, copyrights, logos, brand names, or other intellectual property mentioned or depicted on this site. Such intellectual property remains the property of its respective owners, and any references here are made solely for identification or informational purposes, without implying any affiliation, endorsement, or partnership.
We make no representations or warranties, express or implied, regarding the accuracy, completeness, or suitability of any content or products presented. Nothing on this website should be construed as legal, tax, investment, financial, medical, or other professional advice. In addition, no part of this site—including articles or product references—constitutes a solicitation, recommendation, endorsement, advertisement, or offer to buy or sell any securities, franchises, or other financial instruments, particularly in jurisdictions where such activity would be unlawful.
All content is of a general nature and may not address the specific circumstances of any individual or entity. It is not a substitute for professional advice or services. Any actions you take based on the information provided here are strictly at your own risk. You accept full responsibility for any decisions or outcomes arising from your use of this website and agree to release us from any liability in connection with your use of, or reliance upon, the content or products found herein.