
|
Oil-DRI Corporation of America (ODC) Valation DCF |
Entièrement Modifiable: Adapté À Vos Besoins Dans Excel Ou Sheets
Conception Professionnelle: Modèles Fiables Et Conformes Aux Normes Du Secteur
Pré-Construits Pour Une Utilisation Rapide Et Efficace
Compatible MAC/PC, entièrement débloqué
Aucune Expertise N'Est Requise; Facile À Suivre
Oil-Dri Corporation of America (ODC) Bundle
Améliorez vos stratégies d'investissement avec la calculatrice DCF DCF Corporation of America (ODC)! Explorez les données financières réelles, ajustez les projections et les dépenses de croissance et observez instantanément comment ces modifications affectent la valeur intrinsèque d'ODC.
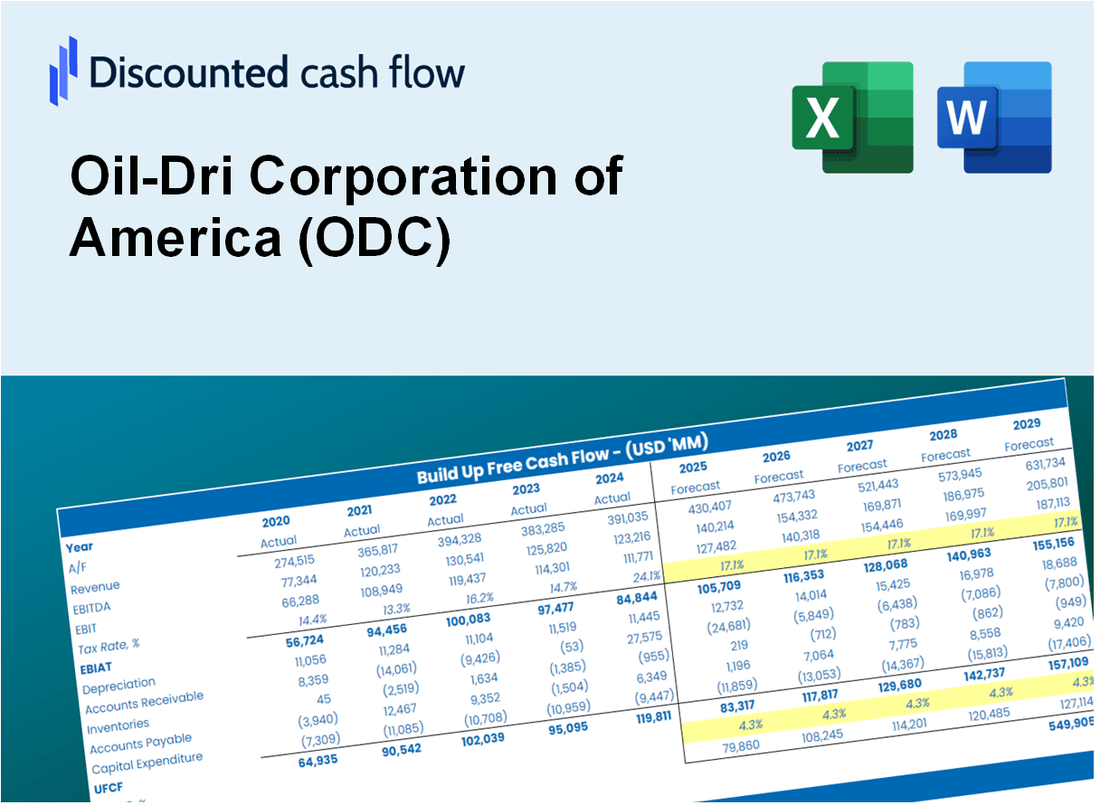
Discounted Cash Flow (DCF) - (USD MM)
| Year | AY1 2021 |
AY2 2022 |
AY3 2023 |
AY4 2024 |
AY5 2025 |
FY1 2026 |
FY2 2027 |
FY3 2028 |
FY4 2029 |
FY5 2030 |
|---|---|---|---|---|---|---|---|---|---|---|
| Revenue | 305.0 | 348.6 | 413.0 | 437.6 | 485.6 | 545.9 | 613.7 | 690.0 | 775.7 | 872.1 |
| Revenue Growth, % | 0 | 14.3 | 18.48 | 5.95 | 10.97 | 12.42 | 12.42 | 12.42 | 12.42 | 12.42 |
| EBITDA | 28.3 | 20.4 | 51.7 | 70.7 | 90.3 | 68.1 | 76.6 | 86.1 | 96.8 | 108.8 |
| EBITDA, % | 9.27 | 5.86 | 12.51 | 16.17 | 18.59 | 12.48 | 12.48 | 12.48 | 12.48 | 12.48 |
| Depreciation | 14.2 | 13.5 | 15.5 | 19.3 | 22.0 | 23.2 | 26.0 | 29.3 | 32.9 | 37.0 |
| Depreciation, % | 4.65 | 3.87 | 3.76 | 4.41 | 4.54 | 4.24 | 4.24 | 4.24 | 4.24 | 4.24 |
| EBIT | 14.1 | 6.9 | 36.1 | 51.5 | 68.2 | 44.9 | 50.5 | 56.8 | 63.9 | 71.8 |
| EBIT, % | 4.62 | 1.99 | 8.75 | 11.76 | 14.05 | 8.23 | 8.23 | 8.23 | 8.23 | 8.23 |
| Total Cash | 24.6 | 16.3 | 31.8 | 24.5 | 50.5 | 39.8 | 44.7 | 50.2 | 56.5 | 63.5 |
| Total Cash, percent | .0 | .0 | .0 | .0 | .0 | .0 | .0 | .0 | .0 | .0 |
| Account Receivables | 40.9 | 51.7 | 59.3 | 62.2 | 69.4 | 77.6 | 87.3 | 98.1 | 110.3 | 124.0 |
| Account Receivables, % | 13.42 | 14.83 | 14.35 | 14.21 | 14.29 | 14.22 | 14.22 | 14.22 | 14.22 | 14.22 |
| Inventories | 23.6 | 35.6 | 42.6 | 54.2 | 51.6 | 56.0 | 62.9 | 70.8 | 79.5 | 89.4 |
| Inventories, % | 7.74 | 10.2 | 10.32 | 12.39 | 10.63 | 10.26 | 10.26 | 10.26 | 10.26 | 10.26 |
| Accounts Payable | 9.2 | 13.4 | 17.1 | 15.0 | 16.8 | 19.5 | 22.0 | 24.7 | 27.8 | 31.2 |
| Accounts Payable, % | 3.02 | 3.84 | 4.14 | 3.43 | 3.46 | 3.58 | 3.58 | 3.58 | 3.58 | 3.58 |
| Capital Expenditure | -18.8 | -22.8 | -24.4 | -32.0 | -32.6 | -35.6 | -40.1 | -45.0 | -50.6 | -56.9 |
| Capital Expenditure, % | -6.18 | -6.55 | -5.9 | -7.31 | -6.71 | -6.53 | -6.53 | -6.53 | -6.53 | -6.53 |
| Tax Rate, % | 18.45 | 18.45 | 18.45 | 18.45 | 18.45 | 18.45 | 18.45 | 18.45 | 18.45 | 18.45 |
| EBITAT | 11.2 | 6.9 | 29.2 | 38.6 | 55.6 | 37.4 | 42.1 | 47.3 | 53.2 | 59.8 |
| Depreciation | ||||||||||
| Changes in Account Receivables | ||||||||||
| Changes in Inventories | ||||||||||
| Changes in Accounts Payable | ||||||||||
| Capital Expenditure | ||||||||||
| UFCF | -48.8 | -21.0 | 9.4 | 9.3 | 42.4 | 15.0 | 13.9 | 15.6 | 17.5 | 19.7 |
| WACC, % | 6.78 | 6.83 | 6.78 | 6.77 | 6.78 | 6.79 | 6.79 | 6.79 | 6.79 | 6.79 |
| PV UFCF | ||||||||||
| SUM PV UFCF | 66.7 | |||||||||
| Long Term Growth Rate, % | 2.00 | |||||||||
| Free cash flow (T + 1) | 20 | |||||||||
| Terminal Value | 420 | |||||||||
| Present Terminal Value | 302 | |||||||||
| Enterprise Value | 369 | |||||||||
| Net Debt | -11 | |||||||||
| Equity Value | 380 | |||||||||
| Diluted Shares Outstanding, MM | 14 | |||||||||
| Equity Value Per Share | 27.35 |
What You Will Get
- Real ODC Financials: Access to historical and projected data for precise valuation.
- Customizable Inputs: Adjust WACC, tax rates, revenue growth, and capital expenditures as needed.
- Dynamic Calculations: Intrinsic value and NPV are computed in real-time.
- Scenario Analysis: Explore various scenarios to assess Oil-Dri’s future performance.
- User-Friendly Design: Designed for professionals while being approachable for newcomers.
Key Features
- Pre-Loaded Data: Oil-Dri Corporation of America's (ODC) historical financial statements and pre-filled forecasts.
- Fully Adjustable Inputs: Modify WACC, tax rates, revenue growth, and EBITDA margins to fit your analysis.
- Instant Results: Watch Oil-Dri's (ODC) intrinsic value recalculate in real time.
- Clear Visual Outputs: Dashboard charts illustrate valuation results and essential metrics.
- Built for Accuracy: A professional-grade tool designed for analysts, investors, and finance professionals.
How It Works
- Step 1: Download the Excel file.
- Step 2: Review pre-entered Oil-Dri Corporation of America (ODC) data (historical and projected).
- Step 3: Adjust key assumptions (yellow cells) based on your analysis.
- Step 4: View automatic recalculations for Oil-Dri Corporation of America’s intrinsic value.
- Step 5: Use the outputs for investment decisions or reporting.
Why Choose This Calculator for Oil-Dri Corporation of America (ODC)?
- Accuracy: Utilizes real Oil-Dri financials to ensure precise data.
- Flexibility: Allows users to easily test and adjust inputs as needed.
- Time-Saving: Eliminate the complexities of creating a DCF model from the ground up.
- Professional-Grade: Crafted with the expertise and usability expected at the CFO level.
- User-Friendly: Intuitive design makes it accessible for users without extensive financial modeling knowledge.
Who Should Use This Product?
- Professional Investors: Develop comprehensive and accurate valuation models for analyzing ODC's portfolio.
- Corporate Finance Teams: Evaluate valuation scenarios to inform strategic decisions within the company.
- Consultants and Advisors: Deliver precise valuation insights for clients interested in Oil-Dri Corporation of America (ODC).
- Students and Educators: Utilize real-world data to enhance learning and practice in financial modeling.
- Industry Analysts: Gain a deeper understanding of how companies like Oil-Dri Corporation of America (ODC) are valued in the market.
What the Template Contains
- Historical Data: Includes Oil-Dri Corporation of America's (ODC) past financials and baseline forecasts.
- DCF and Levered DCF Models: Detailed templates to calculate Oil-Dri Corporation of America's (ODC) intrinsic value.
- WACC Sheet: Pre-built calculations for Weighted Average Cost of Capital.
- Editable Inputs: Modify key drivers like growth rates, EBITDA %, and CAPEX assumptions.
- Quarterly and Annual Statements: A complete breakdown of Oil-Dri Corporation of America's (ODC) financials.
- Interactive Dashboard: Visualize valuation results and projections dynamically.
Disclaimer
All information, articles, and product details provided on this website are for general informational and educational purposes only. We do not claim any ownership over, nor do we intend to infringe upon, any trademarks, copyrights, logos, brand names, or other intellectual property mentioned or depicted on this site. Such intellectual property remains the property of its respective owners, and any references here are made solely for identification or informational purposes, without implying any affiliation, endorsement, or partnership.
We make no representations or warranties, express or implied, regarding the accuracy, completeness, or suitability of any content or products presented. Nothing on this website should be construed as legal, tax, investment, financial, medical, or other professional advice. In addition, no part of this site—including articles or product references—constitutes a solicitation, recommendation, endorsement, advertisement, or offer to buy or sell any securities, franchises, or other financial instruments, particularly in jurisdictions where such activity would be unlawful.
All content is of a general nature and may not address the specific circumstances of any individual or entity. It is not a substitute for professional advice or services. Any actions you take based on the information provided here are strictly at your own risk. You accept full responsibility for any decisions or outcomes arising from your use of this website and agree to release us from any liability in connection with your use of, or reliance upon, the content or products found herein.