
|
Omega Healthcare Investors, Inc. (OHI) Évaluation DCF |
Entièrement Modifiable: Adapté À Vos Besoins Dans Excel Ou Sheets
Conception Professionnelle: Modèles Fiables Et Conformes Aux Normes Du Secteur
Pré-Construits Pour Une Utilisation Rapide Et Efficace
Compatible MAC/PC, entièrement débloqué
Aucune Expertise N'Est Requise; Facile À Suivre
Omega Healthcare Investors, Inc. (OHI) Bundle
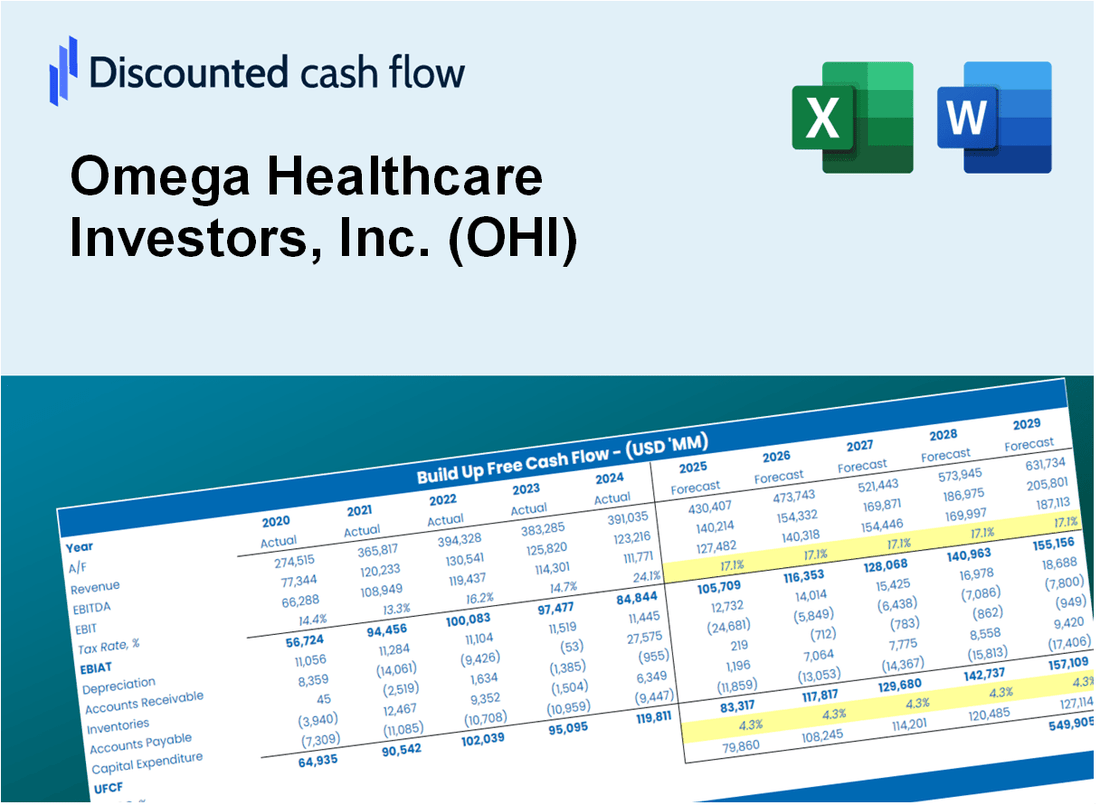
Améliorez vos stratégies d'investissement avec la calculatrice DCF Omega Healthcare Investors, Inc. (OHI)! Explorez des données financières authentiques, ajustez les projections et dépenses de croissance et observez instantanément comment ces changements affectent la valeur intrinsèque d'Omega Healthcare Investors, Inc. (OHI).
What You Will Get
- Real OHI Financial Data: Pre-filled with Omega Healthcare Investors, Inc.'s historical and projected data for precise analysis.
- Fully Editable Template: Modify key inputs like revenue growth, WACC, and EBITDA % with ease.
- Automatic Calculations: See Omega Healthcare's intrinsic value update instantly based on your changes.
- Professional Valuation Tool: Designed for investors, analysts, and consultants seeking accurate DCF results.
- User-Friendly Design: Simple structure and clear instructions for all experience levels.
Key Features
- Real Omega Financials: Access precise pre-loaded historical data and future projections for Omega Healthcare Investors, Inc. (OHI).
- Customizable Forecast Assumptions: Modify yellow-highlighted cells such as WACC, growth rates, and margins to fit your analysis.
- Dynamic Calculations: Automatic updates to DCF, Net Present Value (NPV), and cash flow analysis tailored for OHI.
- Visual Dashboard: User-friendly charts and summaries to help visualize your valuation results for Omega Healthcare Investors, Inc. (OHI).
- For Professionals and Beginners: An intuitive structure designed for investors, CFOs, and consultants interested in OHI.
How It Works
- Step 1: Download the Excel file.
- Step 2: Review pre-entered Omega Healthcare Investors, Inc. (OHI) data (historical and projected).
- Step 3: Adjust key assumptions (yellow cells) based on your analysis.
- Step 4: View automatic recalculations for Omega Healthcare's intrinsic value.
- Step 5: Use the outputs for investment decisions or reporting.
Why Choose This Calculator for Omega Healthcare Investors, Inc. (OHI)?
- Accurate Data: Real Omega Healthcare financials provide dependable valuation results.
- Customizable: Tailor key parameters such as growth rates, WACC, and tax rates to align with your forecasts.
- Time-Saving: Pre-built calculations save you from starting from the ground up.
- Professional-Grade Tool: Crafted for investors, analysts, and consultants in the healthcare sector.
- User-Friendly: Intuitive design and step-by-step guidance ensure ease of use for everyone.
Who Should Use Omega Healthcare Investors, Inc. (OHI)?
- Institutional Investors: Develop comprehensive and trustworthy valuation models for healthcare REIT analysis.
- Financial Analysts: Evaluate valuation scenarios to inform investment strategies in the healthcare sector.
- Investment Advisors: Deliver precise valuation insights to clients considering investments in Omega Healthcare.
- Academic Researchers: Utilize real-world data to study and teach financial modeling in the healthcare industry.
- Healthcare Sector Enthusiasts: Gain insights into how healthcare REITs like Omega Healthcare Investors are valued in the market.
What the Template Contains
- Preloaded OHI Data: Historical and projected financial data, including revenue, EBIT, and capital expenditures.
- DCF and WACC Models: Professional-grade sheets for calculating intrinsic value and Weighted Average Cost of Capital.
- Editable Inputs: Yellow-highlighted cells for adjusting revenue growth, tax rates, and discount rates.
- Financial Statements: Comprehensive annual and quarterly financials for deeper analysis.
- Key Ratios: Profitability, leverage, and efficiency ratios to evaluate performance.
- Dashboard and Charts: Visual summaries of valuation outcomes and assumptions.
Disclaimer
All information, articles, and product details provided on this website are for general informational and educational purposes only. We do not claim any ownership over, nor do we intend to infringe upon, any trademarks, copyrights, logos, brand names, or other intellectual property mentioned or depicted on this site. Such intellectual property remains the property of its respective owners, and any references here are made solely for identification or informational purposes, without implying any affiliation, endorsement, or partnership.
We make no representations or warranties, express or implied, regarding the accuracy, completeness, or suitability of any content or products presented. Nothing on this website should be construed as legal, tax, investment, financial, medical, or other professional advice. In addition, no part of this site—including articles or product references—constitutes a solicitation, recommendation, endorsement, advertisement, or offer to buy or sell any securities, franchises, or other financial instruments, particularly in jurisdictions where such activity would be unlawful.
All content is of a general nature and may not address the specific circumstances of any individual or entity. It is not a substitute for professional advice or services. Any actions you take based on the information provided here are strictly at your own risk. You accept full responsibility for any decisions or outcomes arising from your use of this website and agree to release us from any liability in connection with your use of, or reliance upon, the content or products found herein.