
|
Olaplex Holdings, Inc. (OLPX) Évaluation DCF |
Entièrement Modifiable: Adapté À Vos Besoins Dans Excel Ou Sheets
Conception Professionnelle: Modèles Fiables Et Conformes Aux Normes Du Secteur
Pré-Construits Pour Une Utilisation Rapide Et Efficace
Compatible MAC/PC, entièrement débloqué
Aucune Expertise N'Est Requise; Facile À Suivre
Olaplex Holdings, Inc. (OLPX) Bundle
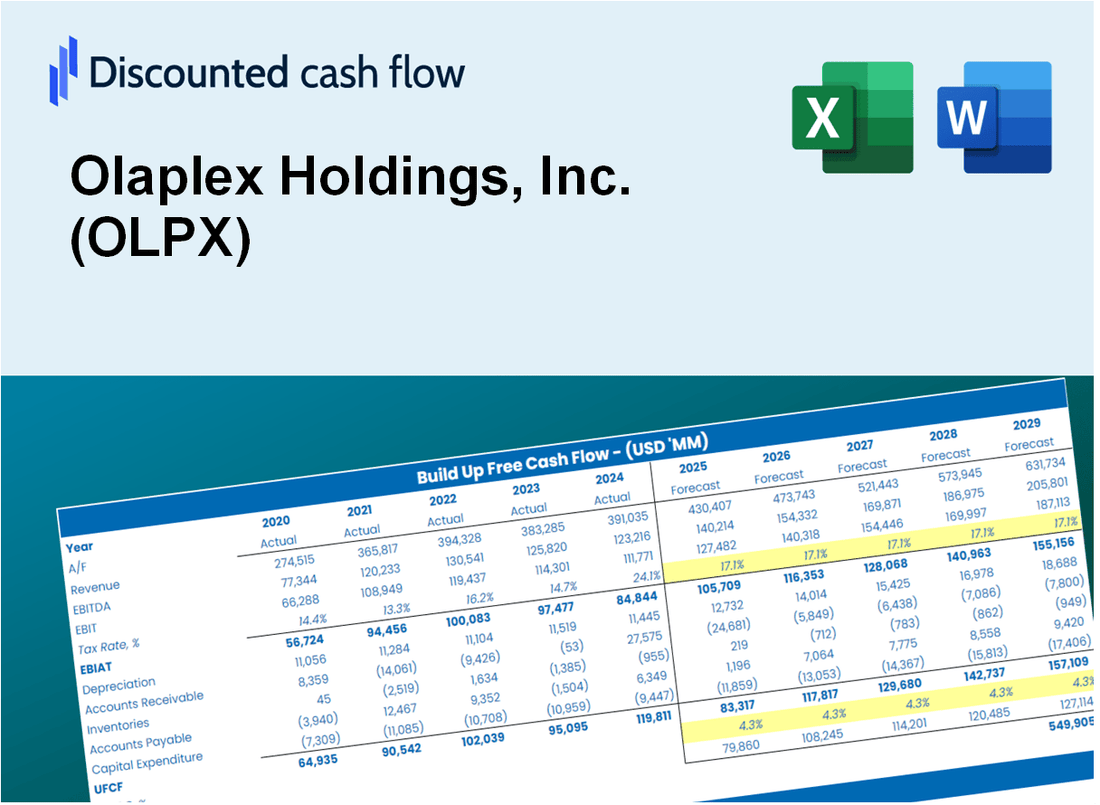
Améliorez vos stratégies d'investissement avec la calculatrice DCF Olaplex Holdings, Inc. (OLPX)! Plongez dans des données financières authentiques, ajustez les prédictions et les dépenses de croissance et observez comment ces modifications affectent la valeur intrinsèque d'Olaplex Holdings, Inc. (OLPX) en temps réel.
What You Will Get
- Pre-Filled Financial Model: Olaplex’s actual data enables precise DCF valuation.
- Full Forecast Control: Adjust revenue growth, margins, WACC, and other key drivers.
- Instant Calculations: Automatic updates ensure you see results as you make changes.
- Investor-Ready Template: A refined Excel file designed for professional-grade valuation.
- Customizable and Reusable: Tailored for flexibility, allowing repeated use for detailed forecasts.
Key Features
- 🔍 Real-Life OLPX Financials: Pre-filled historical and projected data for Olaplex Holdings, Inc.
- ✏️ Fully Customizable Inputs: Adjust all critical parameters (yellow cells) like WACC, growth %, and tax rates.
- 📊 Professional DCF Valuation: Built-in formulas calculate Olaplex’s intrinsic value using the Discounted Cash Flow method.
- ⚡ Instant Results: Visualize Olaplex’s valuation instantly after making changes.
- Scenario Analysis: Test and compare outcomes for various financial assumptions side-by-side.
How It Works
- Download the Template: Gain immediate access to the Excel-based OLPX DCF Calculator.
- Input Your Assumptions: Modify the yellow-highlighted cells for growth rates, WACC, margins, and other variables.
- Instant Calculations: The model automatically recalculates Olaplex’s intrinsic value.
- Test Scenarios: Experiment with different assumptions to assess potential valuation shifts.
- Analyze and Decide: Utilize the results to inform your investment or financial analysis.
Why Choose This Calculator for Olaplex Holdings, Inc. (OLPX)?
- Designed for Industry Leaders: A sophisticated tool tailored for analysts, investors, and financial advisors.
- Accurate Financial Data: Olaplex’s historical and projected financials are preloaded for precision.
- Flexible Scenario Analysis: Effortlessly test various forecasts and scenarios.
- Comprehensive Outputs: Instantly computes intrinsic value, NPV, and essential financial metrics.
- User-Friendly Interface: Step-by-step guidance ensures a smooth calculation experience.
Who Should Use This Product?
- Professional Investors: Create comprehensive and accurate valuation models for analyzing OLPX investments.
- Corporate Finance Teams: Evaluate valuation scenarios to inform strategic decisions for Olaplex Holdings.
- Consultants and Advisors: Deliver precise valuation insights for clients interested in OLPX stock.
- Students and Educators: Utilize real-world data to practice and teach financial modeling with OLPX examples.
- Beauty Industry Enthusiasts: Gain insights into how companies like Olaplex are valued within the beauty market.
What the Template Contains
- Pre-Filled Data: Includes Olaplex Holdings’ historical financials and forecasts.
- Discounted Cash Flow Model: Editable DCF valuation model with automatic calculations.
- Weighted Average Cost of Capital (WACC): A dedicated sheet for calculating WACC based on custom inputs.
- Key Financial Ratios: Analyze Olaplex’s profitability, efficiency, and leverage.
- Customizable Inputs: Edit revenue growth, margins, and tax rates with ease.
- Clear Dashboard: Charts and tables summarizing key valuation results.
Disclaimer
All information, articles, and product details provided on this website are for general informational and educational purposes only. We do not claim any ownership over, nor do we intend to infringe upon, any trademarks, copyrights, logos, brand names, or other intellectual property mentioned or depicted on this site. Such intellectual property remains the property of its respective owners, and any references here are made solely for identification or informational purposes, without implying any affiliation, endorsement, or partnership.
We make no representations or warranties, express or implied, regarding the accuracy, completeness, or suitability of any content or products presented. Nothing on this website should be construed as legal, tax, investment, financial, medical, or other professional advice. In addition, no part of this site—including articles or product references—constitutes a solicitation, recommendation, endorsement, advertisement, or offer to buy or sell any securities, franchises, or other financial instruments, particularly in jurisdictions where such activity would be unlawful.
All content is of a general nature and may not address the specific circumstances of any individual or entity. It is not a substitute for professional advice or services. Any actions you take based on the information provided here are strictly at your own risk. You accept full responsibility for any decisions or outcomes arising from your use of this website and agree to release us from any liability in connection with your use of, or reliance upon, the content or products found herein.