
|
Oil and Natural Gas Corporation Limited (ONGC.NS) Évaluation DCF |
Entièrement Modifiable: Adapté À Vos Besoins Dans Excel Ou Sheets
Conception Professionnelle: Modèles Fiables Et Conformes Aux Normes Du Secteur
Pré-Construits Pour Une Utilisation Rapide Et Efficace
Compatible MAC/PC, entièrement débloqué
Aucune Expertise N'Est Requise; Facile À Suivre
Oil and Natural Gas Corporation Limited (ONGC.NS) Bundle
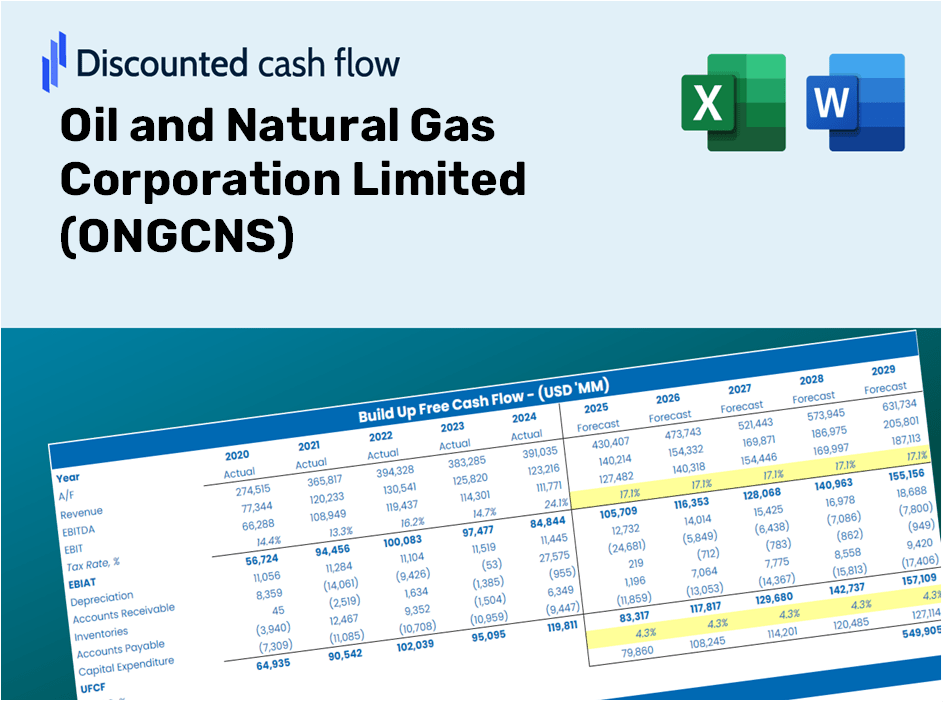
Améliorez vos stratégies d'investissement avec la calculatrice DCF (ONGCNS)! Explorez les données financières réelles de Oil and Natural Gas Corporation Limited, ajustez les projections et dépenses de croissance et observez instantanément comment ces modifications affectent la valeur intrinsèque des (ONGCN).
Discounted Cash Flow (DCF) - (USD MM)
| Year | AY1 2021 |
AY2 2022 |
AY3 2023 |
AY4 2024 |
AY5 2025 |
FY1 2026 |
FY2 2027 |
FY3 2028 |
FY4 2029 |
FY5 2030 |
|---|---|---|---|---|---|---|---|---|---|---|
| Revenue | 3,038,921.9 | 4,913,005.1 | 6,323,259.7 | 6,015,808.8 | 6,630,653.7 | 6,824,707.9 | 7,024,441.3 | 7,230,020.2 | 7,441,615.5 | 7,659,403.5 |
| Revenue Growth, % | 0 | 61.67 | 28.7 | -4.86 | 10.22 | 2.93 | 2.93 | 2.93 | 2.93 | 2.93 |
| EBITDA | 542,506.9 | 770,419.2 | 790,821.4 | 991,273.3 | 856,921.1 | 1,029,727.7 | 1,059,863.9 | 1,090,882.1 | 1,122,808.1 | 1,155,668.5 |
| EBITDA, % | 17.85 | 15.68 | 12.51 | 16.48 | 12.92 | 15.09 | 15.09 | 15.09 | 15.09 | 15.09 |
| Depreciation | 246,481.1 | 265,118.1 | 243,163.6 | 274,549.7 | 312,518.1 | 363,479.0 | 374,116.6 | 385,065.6 | 396,335.0 | 407,934.2 |
| Depreciation, % | 8.11 | 5.4 | 3.85 | 4.56 | 4.71 | 5.33 | 5.33 | 5.33 | 5.33 | 5.33 |
| EBIT | 296,025.8 | 505,301.1 | 547,657.8 | 716,723.6 | 544,403.1 | 666,248.7 | 685,747.3 | 705,816.5 | 726,473.1 | 747,734.2 |
| EBIT, % | 9.74 | 10.28 | 8.66 | 11.91 | 8.21 | 9.76 | 9.76 | 9.76 | 9.76 | 9.76 |
| Total Cash | 132,817.6 | 124,267.8 | 371,087.8 | 471,927.9 | 304,302.6 | 344,001.5 | 354,069.1 | 364,431.4 | 375,096.9 | 386,074.6 |
| Total Cash, percent | .0 | .0 | .0 | .0 | .0 | .0 | .0 | .0 | .0 | .0 |
| Account Receivables | 160,158.3 | 269,502.0 | 283,332.0 | 294,643.4 | 313,514.0 | 339,359.6 | 349,291.4 | 359,513.8 | 370,035.5 | 380,865.0 |
| Account Receivables, % | 5.27 | 5.49 | 4.48 | 4.9 | 4.73 | 4.97 | 4.97 | 4.97 | 4.97 | 4.97 |
| Inventories | 445,733.3 | 541,631.0 | 442,409.1 | 522,505.1 | 589,563.3 | 686,094.2 | 706,173.6 | 726,840.6 | 748,112.5 | 770,006.9 |
| Inventories, % | 14.67 | 11.02 | 7 | 8.69 | 8.89 | 10.05 | 10.05 | 10.05 | 10.05 | 10.05 |
| Accounts Payable | 272,509.3 | 401,860.1 | 336,426.0 | 374,922.1 | 389,755.3 | 471,964.5 | 485,777.1 | 499,994.0 | 514,626.9 | 529,688.1 |
| Accounts Payable, % | 8.97 | 8.18 | 5.32 | 6.23 | 5.88 | 6.92 | 6.92 | 6.92 | 6.92 | 6.92 |
| Capital Expenditure | -430,005.3 | -445,265.1 | -509,302.5 | -519,015.9 | -556,762.1 | -659,153.1 | -678,444.0 | -698,299.5 | -718,736.1 | -739,770.8 |
| Capital Expenditure, % | -14.15 | -9.06 | -8.05 | -8.63 | -8.4 | -9.66 | -9.66 | -9.66 | -9.66 | -9.66 |
| Tax Rate, % | 30.86 | 30.86 | 30.86 | 30.86 | 30.86 | 30.86 | 30.86 | 30.86 | 30.86 | 30.86 |
| EBITAT | 160,208.8 | 425,252.4 | 449,294.7 | 478,378.2 | 376,376.7 | 474,633.2 | 488,523.9 | 502,821.2 | 517,536.9 | 532,683.2 |
| Depreciation | ||||||||||
| Changes in Account Receivables | ||||||||||
| Changes in Inventories | ||||||||||
| Changes in Accounts Payable | ||||||||||
| Capital Expenditure | ||||||||||
| UFCF | -356,697.7 | 169,214.9 | 203,113.5 | 181,000.7 | 61,037.0 | 138,791.7 | 167,998.0 | 172,914.6 | 177,975.2 | 183,183.9 |
| WACC, % | 4.68 | 5.43 | 5.37 | 5 | 5.05 | 5.11 | 5.11 | 5.11 | 5.11 | 5.11 |
| PV UFCF | ||||||||||
| SUM PV UFCF | 721,672.0 | |||||||||
| Long Term Growth Rate, % | 2.00 | |||||||||
| Free cash flow (T + 1) | 186,848 | |||||||||
| Terminal Value | 6,015,154 | |||||||||
| Present Terminal Value | 4,689,251 | |||||||||
| Enterprise Value | 5,410,923 | |||||||||
| Net Debt | 1,606,396 | |||||||||
| Equity Value | 3,804,527 | |||||||||
| Diluted Shares Outstanding, MM | 12,580 | |||||||||
| Equity Value Per Share | 302.42 |
Benefits You Will Receive
- Adjustable Forecast Parameters: Effortlessly modify assumptions (growth %, margins, WACC) to generate various scenarios.
- Comprehensive Financial Data: ONGC's financial information pre-loaded to facilitate your analysis.
- Automated DCF Calculations: The template computes Net Present Value (NPV) and intrinsic value automatically.
- Professional and Adaptable: A refined Excel model that tailors to your valuation requirements.
- Designed for Analysts and Investors: Perfect for assessing projections, confirming strategies, and enhancing efficiency.
Key Features
- Real-Life ONGCNS Data: Pre-filled with ONGC's historical financials and future projections.
- Fully Customizable Inputs: Modify parameters such as production rates, operating costs, WACC, tax rates, and capital expenditures.
- Dynamic Valuation Model: Instant updates to Net Present Value (NPV) and intrinsic value based on your specified inputs.
- Scenario Testing: Develop various forecasting scenarios to evaluate different valuation results.
- User-Friendly Design: Intuitive, organized, and suitable for both industry professionals and newcomers.
How It Functions
- Download the Template: Gain immediate access to the Excel-based ONGC DCF Calculator.
- Input Your Assumptions: Customize the yellow-highlighted cells for growth rates, WACC, margins, and other variables.
- Instant Calculations: The model will automatically refresh ONGC's intrinsic value.
- Test Scenarios: Experiment with various assumptions to assess potential changes in valuation.
- Analyze and Decide: Utilize the outcomes to inform your investment or financial assessments.
Why Choose the ONGC Calculator?
- Save Time: Skip the hassle of building a DCF model from scratch – it’s ready for immediate use.
- Enhance Accuracy: Dependable financial data and formulas minimize valuation errors.
- Fully Customizable: Adjust the model to align with your assumptions and forecasts.
- Easy to Understand: Intuitive charts and outputs simplify result analysis.
- Preferred by Professionals: Crafted for experts who prioritize precision and functionality.
Who Can Benefit from This Product?
- Energy Sector Students: Master valuation methods and utilize real market data.
- Researchers: Integrate industry-standard models into your studies or academic projects.
- Investors: Validate your hypotheses and evaluate valuation metrics for ONGCNS (ONGC).
- Financial Analysts: Enhance your efficiency with a ready-to-use, customizable DCF model.
- Entrepreneurs: Understand how major oil and gas companies like ONGCNS are assessed in the market.
Contents of the Template
- Pre-Filled Data: Contains ONGCNS’s historical financial performance and projections.
- Discounted Cash Flow Model: An editable DCF valuation model featuring automatic calculations.
- Weighted Average Cost of Capital (WACC): A specific worksheet for calculating WACC with tailored inputs.
- Key Financial Ratios: Evaluate ONGCNS’s profitability, efficiency, and financial leverage.
- Customizable Inputs: Easily modify revenue growth, profit margins, and tax rates.
- Clear Dashboard: Visual representations and tables that summarize essential valuation outcomes.
Disclaimer
All information, articles, and product details provided on this website are for general informational and educational purposes only. We do not claim any ownership over, nor do we intend to infringe upon, any trademarks, copyrights, logos, brand names, or other intellectual property mentioned or depicted on this site. Such intellectual property remains the property of its respective owners, and any references here are made solely for identification or informational purposes, without implying any affiliation, endorsement, or partnership.
We make no representations or warranties, express or implied, regarding the accuracy, completeness, or suitability of any content or products presented. Nothing on this website should be construed as legal, tax, investment, financial, medical, or other professional advice. In addition, no part of this site—including articles or product references—constitutes a solicitation, recommendation, endorsement, advertisement, or offer to buy or sell any securities, franchises, or other financial instruments, particularly in jurisdictions where such activity would be unlawful.
All content is of a general nature and may not address the specific circumstances of any individual or entity. It is not a substitute for professional advice or services. Any actions you take based on the information provided here are strictly at your own risk. You accept full responsibility for any decisions or outcomes arising from your use of this website and agree to release us from any liability in connection with your use of, or reliance upon, the content or products found herein.