
|
Opko Health, Inc. (OPK) Évaluation DCF |
Entièrement Modifiable: Adapté À Vos Besoins Dans Excel Ou Sheets
Conception Professionnelle: Modèles Fiables Et Conformes Aux Normes Du Secteur
Pré-Construits Pour Une Utilisation Rapide Et Efficace
Compatible MAC/PC, entièrement débloqué
Aucune Expertise N'Est Requise; Facile À Suivre
OPKO Health, Inc. (OPK) Bundle
Vous cherchez à évaluer la valeur intrinsèque d'Opko Health, Inc.? Notre calculatrice OPK DCF intègre des données réelles ainsi que des fonctionnalités de personnalisation complètes, vous permettant d'ajuster les prévisions et de faire des choix d'investissement éclairés.
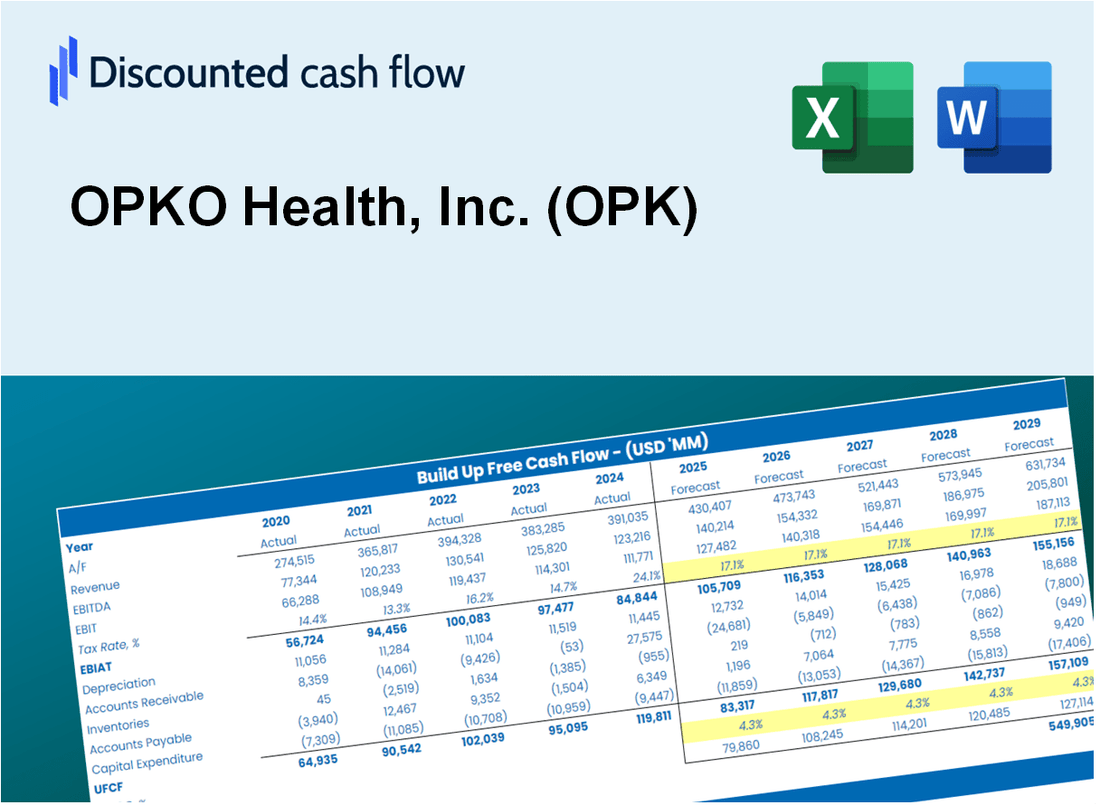
Discounted Cash Flow (DCF) - (USD MM)
| Year | AY1 2020 |
AY2 2021 |
AY3 2022 |
AY4 2023 |
AY5 2024 |
FY1 2025 |
FY2 2026 |
FY3 2027 |
FY4 2028 |
FY5 2029 |
|---|---|---|---|---|---|---|---|---|---|---|
| Revenue | 1,435.4 | 1,774.7 | 1,004.2 | 863.5 | 713.1 | 621.9 | 542.3 | 472.8 | 412.3 | 359.5 |
| Revenue Growth, % | 0 | 23.64 | -43.42 | -14.01 | -17.41 | -12.8 | -12.8 | -12.8 | -12.8 | -12.8 |
| EBITDA | 139.1 | 83.6 | -270.8 | -65.5 | 135.3 | -1.5 | -1.3 | -1.1 | -1.0 | -.9 |
| EBITDA, % | 9.69 | 4.71 | -26.97 | -7.59 | 18.97 | -0.23736 | -0.23736 | -0.23736 | -0.23736 | -0.23736 |
| Depreciation | 85.4 | 78.7 | 108.7 | 105.3 | 98.2 | 58.7 | 51.1 | 44.6 | 38.9 | 33.9 |
| Depreciation, % | 5.95 | 4.44 | 10.82 | 12.19 | 13.77 | 9.43 | 9.43 | 9.43 | 9.43 | 9.43 |
| EBIT | 53.7 | 4.9 | -379.5 | -170.8 | 37.1 | -60.1 | -52.4 | -45.7 | -39.9 | -34.8 |
| EBIT, % | 3.74 | 0.27357 | -37.79 | -19.78 | 5.2 | -9.67 | -9.67 | -9.67 | -9.67 | -9.67 |
| Total Cash | 72.2 | 134.7 | 153.2 | 95.9 | 431.9 | 123.8 | 108.0 | 94.1 | 82.1 | 71.6 |
| Total Cash, percent | .0 | .0 | .0 | .0 | .0 | .0 | .0 | .0 | .0 | .0 |
| Account Receivables | 302.3 | 265.6 | 148.6 | 130.2 | 152.0 | 108.5 | 94.6 | 82.5 | 71.9 | 62.7 |
| Account Receivables, % | 21.06 | 14.97 | 14.8 | 15.08 | 21.32 | 17.44 | 17.44 | 17.44 | 17.44 | 17.44 |
| Inventories | 132.3 | 86.5 | 74.1 | 65.7 | 56.8 | 46.1 | 40.2 | 35.0 | 30.5 | 26.6 |
| Inventories, % | 9.22 | 4.87 | 7.38 | 7.61 | 7.96 | 7.41 | 7.41 | 7.41 | 7.41 | 7.41 |
| Accounts Payable | 100.9 | 82.0 | 61.6 | 69.7 | 47.1 | 40.4 | 35.2 | 30.7 | 26.8 | 23.3 |
| Accounts Payable, % | 7.03 | 4.62 | 6.14 | 8.07 | 6.6 | 6.49 | 6.49 | 6.49 | 6.49 | 6.49 |
| Capital Expenditure | -33.7 | -32.2 | -24.6 | -16.3 | -25.0 | -14.9 | -13.0 | -11.3 | -9.9 | -8.6 |
| Capital Expenditure, % | -2.35 | -1.81 | -2.45 | -1.88 | -3.51 | -2.4 | -2.4 | -2.4 | -2.4 | -2.4 |
| Tax Rate, % | -413.65 | -413.65 | -413.65 | -413.65 | -413.65 | -413.65 | -413.65 | -413.65 | -413.65 | -413.65 |
| EBITAT | 33.7 | 10.0 | -318.3 | -174.9 | 190.6 | -53.7 | -46.8 | -40.8 | -35.6 | -31.1 |
| Depreciation | ||||||||||
| Changes in Account Receivables | ||||||||||
| Changes in Inventories | ||||||||||
| Changes in Accounts Payable | ||||||||||
| Capital Expenditure | ||||||||||
| UFCF | -248.3 | 120.2 | -125.2 | -51.1 | 228.2 | 37.6 | 5.9 | 5.2 | 4.5 | 3.9 |
| WACC, % | 8.57 | 9.84 | 9.29 | 9.84 | 9.84 | 9.48 | 9.48 | 9.48 | 9.48 | 9.48 |
| PV UFCF | ||||||||||
| SUM PV UFCF | 48.8 | |||||||||
| Long Term Growth Rate, % | 2.00 | |||||||||
| Free cash flow (T + 1) | 4 | |||||||||
| Terminal Value | 53 | |||||||||
| Present Terminal Value | 34 | |||||||||
| Enterprise Value | 83 | |||||||||
| Net Debt | 73 | |||||||||
| Equity Value | 10 | |||||||||
| Diluted Shares Outstanding, MM | 694 | |||||||||
| Equity Value Per Share | 0.01 |
What You Will Get
- Real OPKO Data: Preloaded financials – from revenue to EBIT – based on actual and projected figures.
- Full Customization: Adjust all critical parameters (yellow cells) like WACC, growth %, and tax rates.
- Instant Valuation Updates: Automatic recalculations to analyze the impact of changes on OPKO Health’s fair value.
- Versatile Excel Template: Tailored for quick edits, scenario testing, and detailed projections.
- Time-Saving and Accurate: Skip building models from scratch while maintaining precision and flexibility.
Key Features
- Comprehensive OPKO Financials: Access precise pre-loaded historical data and future projections for OPKO Health, Inc. (OPK).
- Tailorable Forecast Assumptions: Modify yellow-highlighted cells such as WACC, growth rates, and profit margins.
- Real-Time Calculations: Automatic updates for DCF, Net Present Value (NPV), and cash flow analysis.
- Intuitive Visual Dashboard: User-friendly charts and summaries to help visualize your valuation outcomes.
- Designed for All Users: A straightforward, intuitive layout suitable for investors, CFOs, and consultants.
How It Works
- Step 1: Download the prebuilt Excel template containing OPKO Health, Inc.'s (OPK) data.
- Step 2: Review the pre-filled sheets to familiarize yourself with the essential metrics.
- Step 3: Modify forecasts and assumptions in the editable yellow cells (WACC, growth, margins).
- Step 4: Instantly see the updated results, including OPKO Health, Inc.'s (OPK) intrinsic value.
- Step 5: Make well-informed investment choices or create reports based on the results.
Why Choose the OPKO Health Calculator?
- Comprehensive Tool: Integrates DCF, WACC, and financial ratio analyses tailored for OPKO Health, Inc. (OPK).
- Customizable Inputs: Modify the yellow-highlighted cells to explore different financial scenarios.
- Detailed Insights: Automatically computes OPKO Health’s intrinsic value and Net Present Value.
- Preloaded Data: Access to historical and forecasted data for accurate financial assessments.
- Professional Quality: Perfect for financial analysts, investors, and business consultants focusing on OPKO Health, Inc. (OPK).
Who Should Use OPKO Health, Inc. (OPK)?
- Investors: Make informed decisions with a comprehensive analysis of OPKO Health's market potential.
- Healthcare Analysts: Streamline your research with readily available data and insights on OPKO Health's operations.
- Consultants: Effortlessly tailor presentations and reports focused on OPKO Health for your clients.
- Biotech Enthusiasts: Enhance your knowledge of the pharmaceutical industry through OPKO Health's innovative approaches.
- Educators and Students: Utilize it as a valuable resource for studying healthcare finance and investment strategies.
What the Template Contains
- Pre-Filled Data: Includes OPKO Health’s historical financials and forecasts.
- Discounted Cash Flow Model: Editable DCF valuation model with automatic calculations.
- Weighted Average Cost of Capital (WACC): A dedicated sheet for calculating WACC based on custom inputs.
- Key Financial Ratios: Analyze OPKO Health’s profitability, efficiency, and leverage.
- Customizable Inputs: Edit revenue growth, margins, and tax rates with ease.
- Clear Dashboard: Charts and tables summarizing key valuation results.
Disclaimer
All information, articles, and product details provided on this website are for general informational and educational purposes only. We do not claim any ownership over, nor do we intend to infringe upon, any trademarks, copyrights, logos, brand names, or other intellectual property mentioned or depicted on this site. Such intellectual property remains the property of its respective owners, and any references here are made solely for identification or informational purposes, without implying any affiliation, endorsement, or partnership.
We make no representations or warranties, express or implied, regarding the accuracy, completeness, or suitability of any content or products presented. Nothing on this website should be construed as legal, tax, investment, financial, medical, or other professional advice. In addition, no part of this site—including articles or product references—constitutes a solicitation, recommendation, endorsement, advertisement, or offer to buy or sell any securities, franchises, or other financial instruments, particularly in jurisdictions where such activity would be unlawful.
All content is of a general nature and may not address the specific circumstances of any individual or entity. It is not a substitute for professional advice or services. Any actions you take based on the information provided here are strictly at your own risk. You accept full responsibility for any decisions or outcomes arising from your use of this website and agree to release us from any liability in connection with your use of, or reliance upon, the content or products found herein.